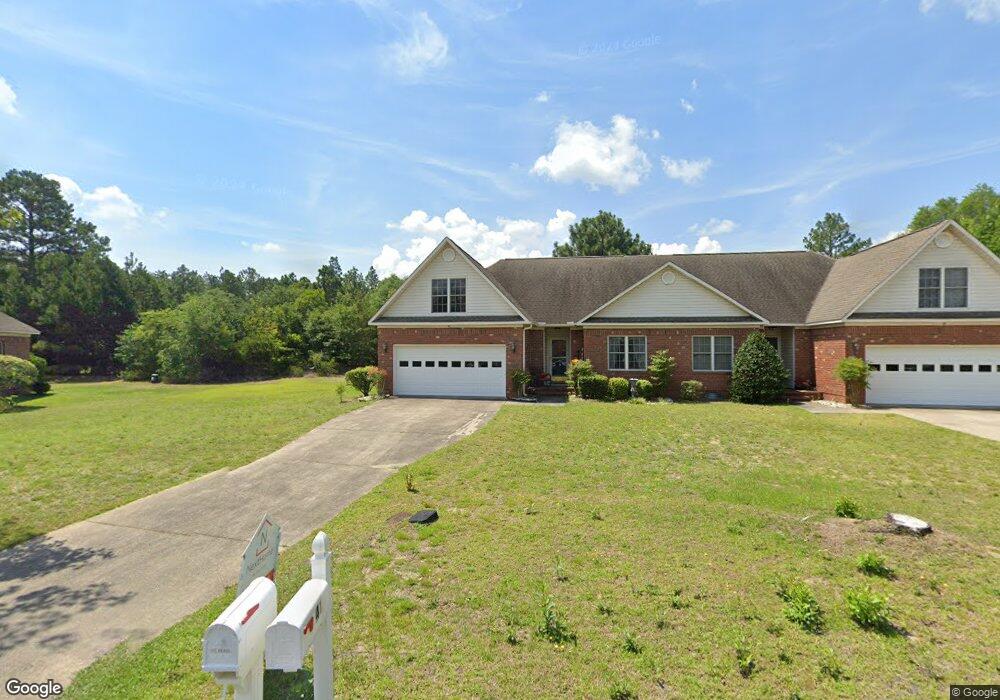
44 Fox Tail Ln Jackson Springs, NC 27281
Estimated Value: $261,000 - $303,000
3
Beds
3
Baths
1,422
Sq Ft
$195/Sq Ft
Est. Value
About This Home
This home is located at 44 Fox Tail Ln, Jackson Springs, NC 27281 and is currently estimated at $277,406, approximately $195 per square foot. 44 Fox Tail Ln is a home located in Moore County with nearby schools including West End Elementary School, West Pine Middle School, and Pinecrest High School.
Ownership History
Date
Name
Owned For
Owner Type
Purchase Details
Closed on
May 24, 2024
Sold by
Saulitis Sally
Bought by
Conard Lydia W and Connor Melody W
Current Estimated Value
Home Financials for this Owner
Home Financials are based on the most recent Mortgage that was taken out on this home.
Original Mortgage
$212,600
Outstanding Balance
$205,792
Interest Rate
7.02%
Mortgage Type
New Conventional
Estimated Equity
$71,614
Purchase Details
Closed on
May 6, 2024
Sold by
Saulitis Andrew and Saulitis Sally A
Bought by
Saulitis Sally
Home Financials for this Owner
Home Financials are based on the most recent Mortgage that was taken out on this home.
Original Mortgage
$212,600
Outstanding Balance
$205,792
Interest Rate
7.02%
Mortgage Type
New Conventional
Estimated Equity
$71,614
Purchase Details
Closed on
Apr 26, 2022
Sold by
Wands Elizabeth K
Bought by
Saulitis Andrew and Saulitis Sally A
Create a Home Valuation Report for This Property
The Home Valuation Report is an in-depth analysis detailing your home's value as well as a comparison with similar homes in the area
Home Values in the Area
Average Home Value in this Area
Purchase History
| Date | Buyer | Sale Price | Title Company |
|---|---|---|---|
| Conard Lydia W | $265,500 | None Listed On Document | |
| Saulitis Sally | -- | None Listed On Document | |
| Saulitis Andrew | $215,000 | None Listed On Document |
Source: Public Records
Mortgage History
| Date | Status | Borrower | Loan Amount |
|---|---|---|---|
| Open | Conard Lydia W | $212,600 |
Source: Public Records
Tax History Compared to Growth
Tax History
| Year | Tax Paid | Tax Assessment Tax Assessment Total Assessment is a certain percentage of the fair market value that is determined by local assessors to be the total taxable value of land and additions on the property. | Land | Improvement |
|---|---|---|---|---|
| 2024 | $1,477 | $231,740 | $25,000 | $206,740 |
| 2023 | $852 | $231,740 | $25,000 | $206,740 |
| 2022 | $906 | $172,630 | $17,000 | $155,630 |
| 2021 | $949 | $172,630 | $17,000 | $155,630 |
| 2020 | $949 | $172,630 | $17,000 | $155,630 |
| 2019 | $949 | $172,630 | $17,000 | $155,630 |
| 2018 | $812 | $160,810 | $17,000 | $143,810 |
| 2017 | $796 | $160,810 | $17,000 | $143,810 |
| 2015 | $780 | $160,810 | $17,000 | $143,810 |
| 2014 | $761 | $156,850 | $15,000 | $141,850 |
| 2013 | -- | $156,850 | $15,000 | $141,850 |
Source: Public Records
Map
Nearby Homes