Estimated Value: $545,000 - $596,000
3
Beds
2
Baths
1,100
Sq Ft
$526/Sq Ft
Est. Value
About This Home
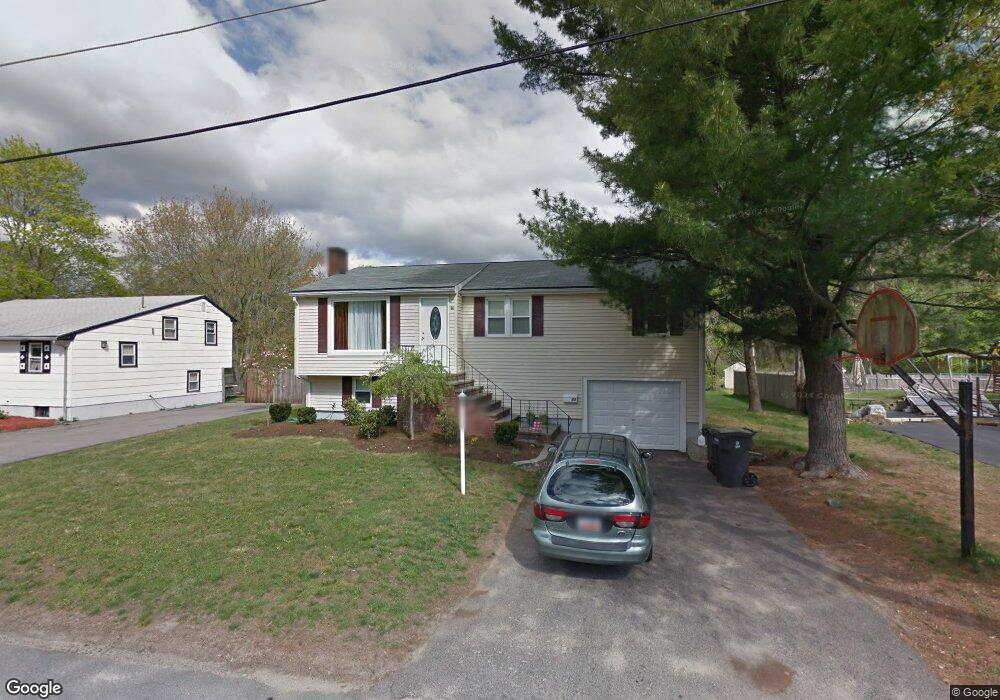
This home is located at 44 Gill St, Avon, MA 02322 and is currently estimated at $578,444, approximately $525 per square foot. 44 Gill St is a home located in Norfolk County with nearby schools including Ralph D. Butler Elementary School and Avon Middle/High School.
Ownership History
Date
Name
Owned For
Owner Type
Purchase Details
Closed on
Dec 18, 2006
Sold by
Washburn Brian M
Bought by
Washburn Brian M and Washburn Lauren M
Current Estimated Value
Purchase Details
Closed on
Jul 14, 2005
Sold by
Caulfield Donald J and Caulfield Keith D
Bought by
Washburn Brian M
Home Financials for this Owner
Home Financials are based on the most recent Mortgage that was taken out on this home.
Original Mortgage
$233,600
Interest Rate
5.67%
Mortgage Type
Purchase Money Mortgage
Purchase Details
Closed on
Dec 29, 1988
Sold by
Caulfield Robert
Bought by
Caulfield Keith D
Home Financials for this Owner
Home Financials are based on the most recent Mortgage that was taken out on this home.
Original Mortgage
$136,000
Interest Rate
10.26%
Mortgage Type
Purchase Money Mortgage
Create a Home Valuation Report for This Property
The Home Valuation Report is an in-depth analysis detailing your home's value as well as a comparison with similar homes in the area
Home Values in the Area
Average Home Value in this Area
Purchase History
| Date | Buyer | Sale Price | Title Company |
|---|---|---|---|
| Washburn Brian M | -- | -- | |
| Washburn Brian M | $292,000 | -- | |
| Caulfield Keith D | $170,000 | -- |
Source: Public Records
Mortgage History
| Date | Status | Borrower | Loan Amount |
|---|---|---|---|
| Previous Owner | Washburn Brian M | $65,000 | |
| Previous Owner | Washburn Brian M | $233,600 | |
| Previous Owner | Caulfield Keith D | $136,000 |
Source: Public Records
Tax History
| Year | Tax Paid | Tax Assessment Tax Assessment Total Assessment is a certain percentage of the fair market value that is determined by local assessors to be the total taxable value of land and additions on the property. | Land | Improvement |
|---|---|---|---|---|
| 2025 | $69 | $515,100 | $222,700 | $292,400 |
| 2024 | $6,299 | $449,000 | $201,900 | $247,100 |
| 2023 | $6,115 | $449,000 | $201,900 | $247,100 |
| 2022 | $6,727 | $425,500 | $168,300 | $257,200 |
| 2021 | $6,381 | $380,300 | $152,700 | $227,600 |
| 2020 | $6,027 | $340,500 | $149,800 | $190,700 |
| 2019 | $5,850 | $325,200 | $143,100 | $182,100 |
| 2018 | $6,149 | $331,500 | $143,100 | $188,400 |
| 2017 | $4,527 | $262,000 | $143,100 | $118,900 |
| 2016 | $4,478 | $261,700 | $136,200 | $125,500 |
| 2015 | $4,091 | $249,900 | $129,900 | $120,000 |
Source: Public Records
Map
Nearby Homes
Your Personal Tour Guide
Ask me questions while you tour the home.