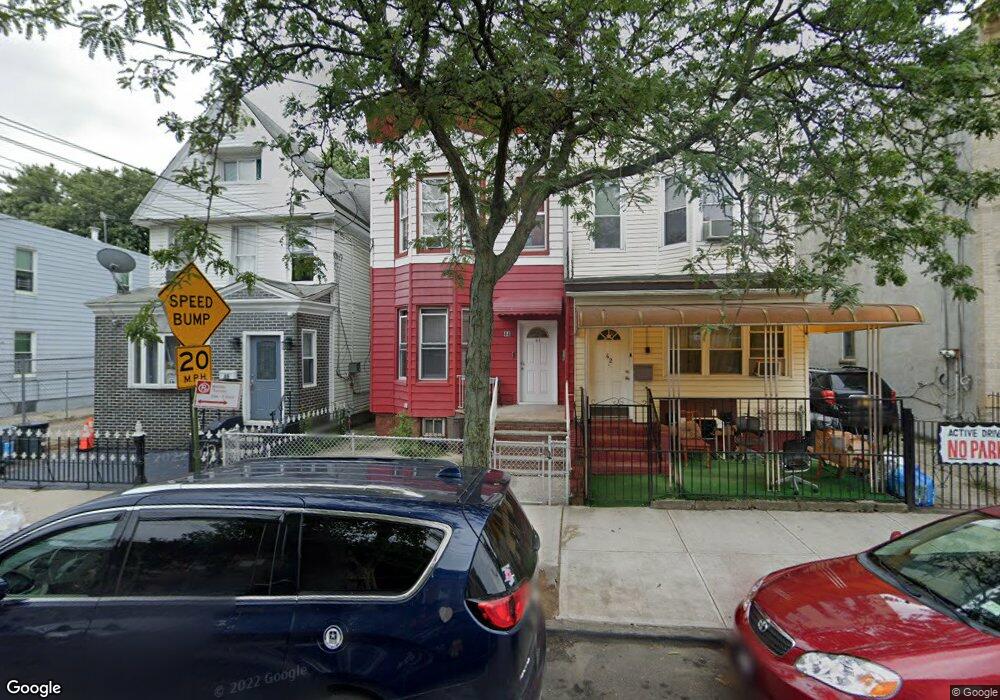
44 Grant Ave Brooklyn, NY 11208
Cypress Hills NeighborhoodEstimated Value: $878,000 - $961,000
--
Bed
--
Bath
1,668
Sq Ft
$553/Sq Ft
Est. Value
About This Home
This home is located at 44 Grant Ave, Brooklyn, NY 11208 and is currently estimated at $922,667, approximately $553 per square foot. 44 Grant Ave is a home located in Kings County with nearby schools including P.S. 7 - Abraham Lincoln, Westridge Elementary School, and Is 171 Abraham Lincoln.
Ownership History
Date
Name
Owned For
Owner Type
Purchase Details
Closed on
Mar 23, 2021
Sold by
Enal Larose Sole Heirs At Law Of Marie and Jennifer Larose
Bought by
Larose Enal and Larose Jennifer
Current Estimated Value
Purchase Details
Closed on
Apr 13, 2005
Sold by
Larose Marie H and Leconte Jean Claude
Bought by
Larose Marie H
Purchase Details
Closed on
Sep 30, 1999
Sold by
Anaya Ana
Bought by
Larose Marie H and Leconte Jean Claude
Home Financials for this Owner
Home Financials are based on the most recent Mortgage that was taken out on this home.
Original Mortgage
$195,300
Interest Rate
7.84%
Mortgage Type
FHA
Create a Home Valuation Report for This Property
The Home Valuation Report is an in-depth analysis detailing your home's value as well as a comparison with similar homes in the area
Home Values in the Area
Average Home Value in this Area
Purchase History
| Date | Buyer | Sale Price | Title Company |
|---|---|---|---|
| Larose Enal | -- | -- | |
| Larose Enal | -- | -- | |
| Larose Enal | -- | -- | |
| Larose Marie H | -- | -- | |
| Larose Marie H | -- | -- | |
| Larose Marie H | $197,000 | Washington Title Insurance C | |
| Larose Marie H | $197,000 | Washington Title Insurance C |
Source: Public Records
Mortgage History
| Date | Status | Borrower | Loan Amount |
|---|---|---|---|
| Previous Owner | Larose Marie H | $195,300 | |
| Closed | Larose Marie H | $0 |
Source: Public Records
Tax History Compared to Growth
Tax History
| Year | Tax Paid | Tax Assessment Tax Assessment Total Assessment is a certain percentage of the fair market value that is determined by local assessors to be the total taxable value of land and additions on the property. | Land | Improvement |
|---|---|---|---|---|
| 2025 | $4,835 | $49,800 | $16,440 | $33,360 |
| 2024 | $4,835 | $42,420 | $16,440 | $25,980 |
| 2023 | $4,627 | $52,020 | $16,440 | $35,580 |
| 2022 | $4,291 | $46,680 | $16,440 | $30,240 |
| 2021 | $4,524 | $36,900 | $16,440 | $20,460 |
| 2020 | $781 | $27,600 | $16,440 | $11,160 |
| 2019 | $1,439 | $27,600 | $16,440 | $11,160 |
| 2018 | $1,276 | $18,987 | $9,257 | $9,730 |
| 2017 | $1,180 | $17,914 | $9,797 | $8,117 |
| 2016 | $1,170 | $17,914 | $9,192 | $8,722 |
| 2015 | $2,038 | $17,690 | $12,594 | $5,096 |
| 2014 | $2,038 | $16,719 | $14,277 | $2,442 |
Source: Public Records
Map
Nearby Homes
- 42 Grant Ave
- 46 Grant Ave
- 36 Grant Ave
- 48 Grant Ave
- 54 Grant Ave
- 54 Grant Ave Unit 1
- 54 Grant Ave Unit 2
- 34 Grant Ave
- 34 Grant Ave Unit 1 FL
- 34 Grant Ave Unit 6
- 34 Grant Ave Unit 8
- 30 Grant Ave
- 30 Grant Ave Unit 8
- 56 Grant Ave
- 26 Grant Ave
- 58 Grant Ave
- 29 Nichols Ave
- 35 Nichols Ave
- 35 Nichols Ave Unit 1
- 35 Nichols Ave Unit 2