Estimated Value: $248,036 - $281,000
4
Beds
1
Bath
1,320
Sq Ft
$206/Sq Ft
Est. Value
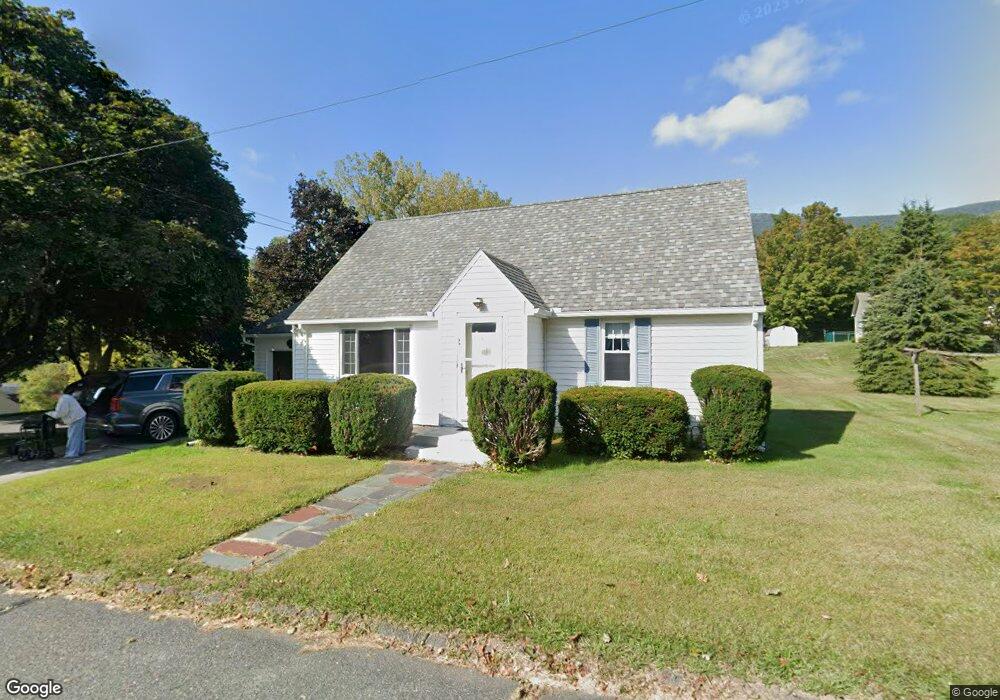
About This Home
This home is located at 44 Greylock Ave, Adams, MA 01220 and is currently estimated at $272,259, approximately $206 per square foot. 44 Greylock Ave is a home located in Berkshire County with nearby schools including Hoosac Valley Middle & High School, Berkshire Arts & Technology Charter Public School, and St. Stanislaus Kostka School.
Ownership History
Date
Name
Owned For
Owner Type
Purchase Details
Closed on
Mar 6, 2006
Sold by
Poirot Henry S and Poirot Carolyn I
Bought by
Poirot Henry S
Current Estimated Value
Purchase Details
Closed on
Feb 8, 1999
Sold by
Gancarz Gene S and Gancarz Catherine M
Bought by
Poirot Henry S
Purchase Details
Closed on
Nov 16, 1987
Sold by
Koscielniak Edwin L
Bought by
Gancarz Gene S
Home Financials for this Owner
Home Financials are based on the most recent Mortgage that was taken out on this home.
Original Mortgage
$124,000
Interest Rate
11.13%
Mortgage Type
Purchase Money Mortgage
Create a Home Valuation Report for This Property
The Home Valuation Report is an in-depth analysis detailing your home's value as well as a comparison with similar homes in the area
Home Values in the Area
Average Home Value in this Area
Purchase History
| Date | Buyer | Sale Price | Title Company |
|---|---|---|---|
| Poirot Henry S | -- | -- | |
| Poirot Henry S | $78,489 | -- | |
| Gancarz Gene S | $95,000 | -- |
Source: Public Records
Mortgage History
| Date | Status | Borrower | Loan Amount |
|---|---|---|---|
| Previous Owner | Gancarz Gene S | $75,600 | |
| Previous Owner | Gancarz Gene S | $124,000 |
Source: Public Records
Tax History
| Year | Tax Paid | Tax Assessment Tax Assessment Total Assessment is a certain percentage of the fair market value that is determined by local assessors to be the total taxable value of land and additions on the property. | Land | Improvement |
|---|---|---|---|---|
| 2025 | $3,359 | $197,500 | $43,200 | $154,300 |
| 2024 | $3,164 | $180,400 | $40,600 | $139,800 |
| 2023 | $2,938 | $158,400 | $36,900 | $121,500 |
| 2022 | $2,858 | $136,800 | $32,100 | $104,700 |
| 2021 | $2,791 | $123,400 | $32,100 | $91,300 |
| 2020 | $2,669 | $122,000 | $32,100 | $89,900 |
| 2019 | $2,610 | $122,000 | $32,100 | $89,900 |
| 2018 | $2,672 | $120,300 | $32,100 | $88,200 |
| 2017 | $2,571 | $120,300 | $32,100 | $88,200 |
| 2016 | $2,229 | $104,200 | $32,100 | $72,100 |
| 2015 | $2,184 | $102,200 | $33,600 | $68,600 |
| 2014 | $2,039 | $102,200 | $33,600 | $68,600 |
Source: Public Records
Map
Nearby Homes
Your Personal Tour Guide
Ask me questions while you tour the home.