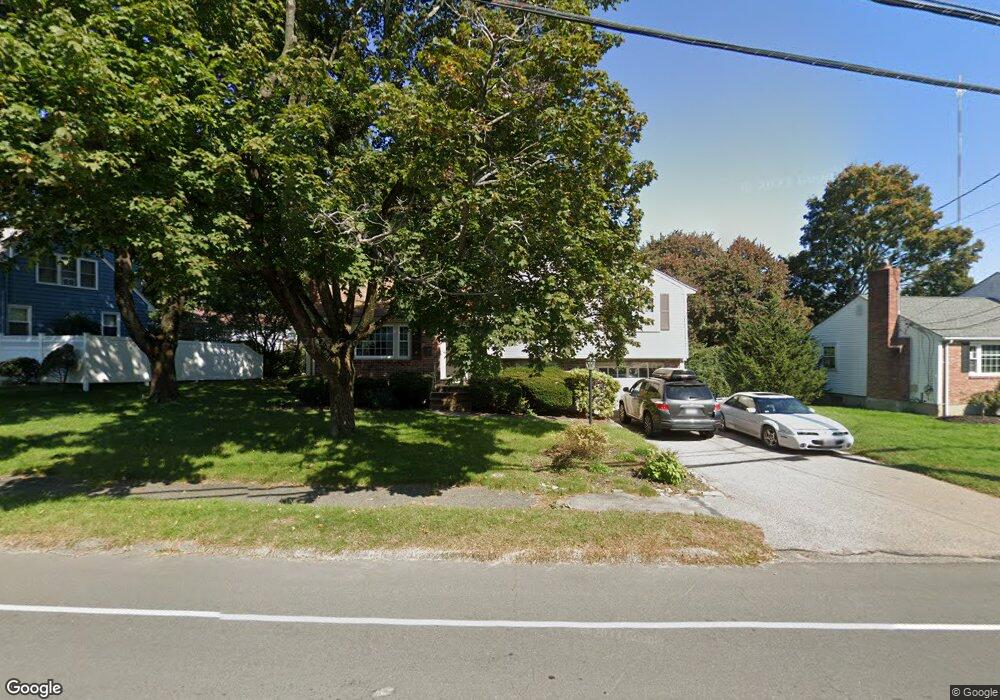
44 Hunting Rd Needham Heights, MA 02494
Estimated Value: $1,018,000 - $1,230,000
3
Beds
2
Baths
1,500
Sq Ft
$735/Sq Ft
Est. Value
About This Home
This home is located at 44 Hunting Rd, Needham Heights, MA 02494 and is currently estimated at $1,102,929, approximately $735 per square foot. 44 Hunting Rd is a home located in Norfolk County with nearby schools including Eliot Elementary School, High Rock Middle School, and Pollard Middle School.
Ownership History
Date
Name
Owned For
Owner Type
Purchase Details
Closed on
Jun 30, 2011
Sold by
44 Hunting Road Rt and Lenahan Sharon R
Bought by
Weekes Brian A and Weekes Nadine R
Current Estimated Value
Home Financials for this Owner
Home Financials are based on the most recent Mortgage that was taken out on this home.
Original Mortgage
$499,507
Outstanding Balance
$347,513
Interest Rate
4.75%
Mortgage Type
FHA
Estimated Equity
$755,416
Purchase Details
Closed on
Jul 9, 2010
Sold by
Rose Rossi Ret and Rossi Stephen C
Bought by
Lenahan Sharon R and Rossi Stephen C
Purchase Details
Closed on
May 15, 2007
Sold by
Rose Rossi Ret and Rossi Rose
Bought by
Rose Rossi Ret and Rossi Rose
Create a Home Valuation Report for This Property
The Home Valuation Report is an in-depth analysis detailing your home's value as well as a comparison with similar homes in the area
Home Values in the Area
Average Home Value in this Area
Purchase History
| Date | Buyer | Sale Price | Title Company |
|---|---|---|---|
| Weekes Brian A | $512,500 | -- | |
| Lenahan Sharon R | -- | -- | |
| Rose Rossi Ret | -- | -- |
Source: Public Records
Mortgage History
| Date | Status | Borrower | Loan Amount |
|---|---|---|---|
| Open | Weekes Brian A | $499,507 |
Source: Public Records
Tax History Compared to Growth
Tax History
| Year | Tax Paid | Tax Assessment Tax Assessment Total Assessment is a certain percentage of the fair market value that is determined by local assessors to be the total taxable value of land and additions on the property. | Land | Improvement |
|---|---|---|---|---|
| 2025 | $9,701 | $915,200 | $670,300 | $244,900 |
| 2024 | $9,072 | $724,600 | $480,500 | $244,100 |
| 2023 | $9,172 | $703,400 | $480,500 | $222,900 |
| 2022 | $8,628 | $645,300 | $429,000 | $216,300 |
| 2021 | $8,408 | $645,300 | $429,000 | $216,300 |
| 2020 | $8,109 | $649,200 | $429,000 | $220,200 |
| 2019 | $7,528 | $607,600 | $390,000 | $217,600 |
| 2018 | $7,218 | $607,600 | $390,000 | $217,600 |
| 2017 | $6,882 | $578,800 | $390,000 | $188,800 |
| 2016 | $6,679 | $578,800 | $390,000 | $188,800 |
| 2015 | $6,535 | $578,800 | $390,000 | $188,800 |
| 2014 | $5,921 | $508,700 | $325,000 | $183,700 |
Source: Public Records
Map
Nearby Homes
- 36 Davenport Rd
- 143 Hunting Rd
- 9 Jayne Rd
- 62 Evelyn Rd
- 7 Avery St
- 41 Lee Rd
- 39 Mark Lee Rd
- 400 Hunnewell St Unit 103
- 379 Hunnewell St Unit 379
- 23 Cheney St
- 3 Crescent Rd
- 1 Williams Ct
- 35 Andrea Cir
- 130 Central Ave
- 193 Oak St Unit 403
- 345 Central Ave
- 54 Indiana Terrace
- 183 Oak St Unit 307
- 183 Oak St Unit 404
- 183 Oak St Unit 205