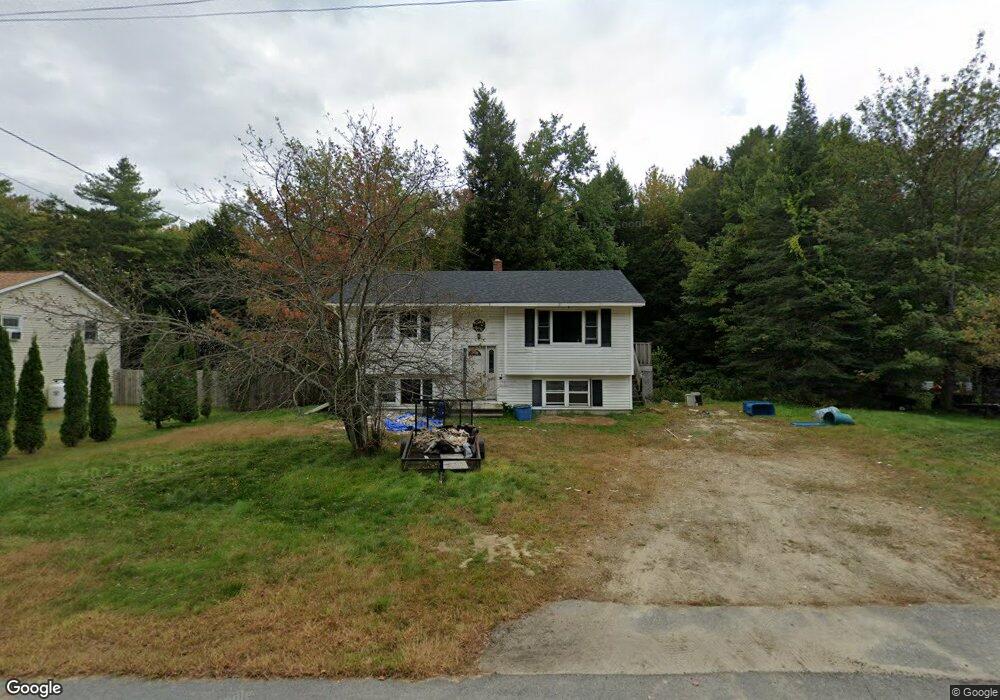
44 Huston St Lisbon Falls, ME 04252
Estimated Value: $305,000 - $336,548
3
Beds
1
Bath
828
Sq Ft
$391/Sq Ft
Est. Value
About This Home
This home is located at 44 Huston St, Lisbon Falls, ME 04252 and is currently estimated at $324,137, approximately $391 per square foot. 44 Huston St is a home with nearby schools including Lisbon Community School, Philip W. Sugg Middle School, and Lisbon High School.
Ownership History
Date
Name
Owned For
Owner Type
Purchase Details
Closed on
Aug 7, 2024
Sold by
Mcwilliams Lisa G
Bought by
Maclean Samuel
Current Estimated Value
Purchase Details
Closed on
Jul 31, 2024
Sold by
Lisbon Town Of
Bought by
Knight Lisa
Purchase Details
Closed on
Nov 28, 2023
Sold by
Lisbon Town Of
Bought by
Knight Lisa
Create a Home Valuation Report for This Property
The Home Valuation Report is an in-depth analysis detailing your home's value as well as a comparison with similar homes in the area
Home Values in the Area
Average Home Value in this Area
Purchase History
| Date | Buyer | Sale Price | Title Company |
|---|---|---|---|
| Maclean Samuel | $60,000 | None Available | |
| Maclean Samuel | $60,000 | None Available | |
| Knight Lisa | -- | None Available | |
| Knight Lisa | -- | None Available | |
| Knight Lisa | -- | None Available | |
| Knight Lisa | -- | None Available |
Source: Public Records
Tax History Compared to Growth
Tax History
| Year | Tax Paid | Tax Assessment Tax Assessment Total Assessment is a certain percentage of the fair market value that is determined by local assessors to be the total taxable value of land and additions on the property. | Land | Improvement |
|---|---|---|---|---|
| 2024 | $3,268 | $240,300 | $57,900 | $182,400 |
| 2023 | $2,946 | $139,600 | $38,200 | $101,400 |
| 2022 | $3,225 | $139,600 | $38,200 | $101,400 |
| 2021 | $3,085 | $139,600 | $38,200 | $101,400 |
| 2020 | $3,225 | $139,600 | $38,200 | $101,400 |
| 2019 | $3,225 | $139,600 | $38,200 | $101,400 |
| 2018 | $3,021 | $121,600 | $33,200 | $88,400 |
| 2017 | $2,821 | $121,600 | $33,200 | $88,400 |
| 2016 | $2,724 | $121,600 | $33,200 | $88,400 |
| 2015 | $2,541 | $107,700 | $33,700 | $74,000 |
| 2014 | $2,418 | $107,700 | $33,700 | $74,000 |
| 2013 | -- | $107,700 | $33,700 | $74,000 |
Source: Public Records
Map
Nearby Homes