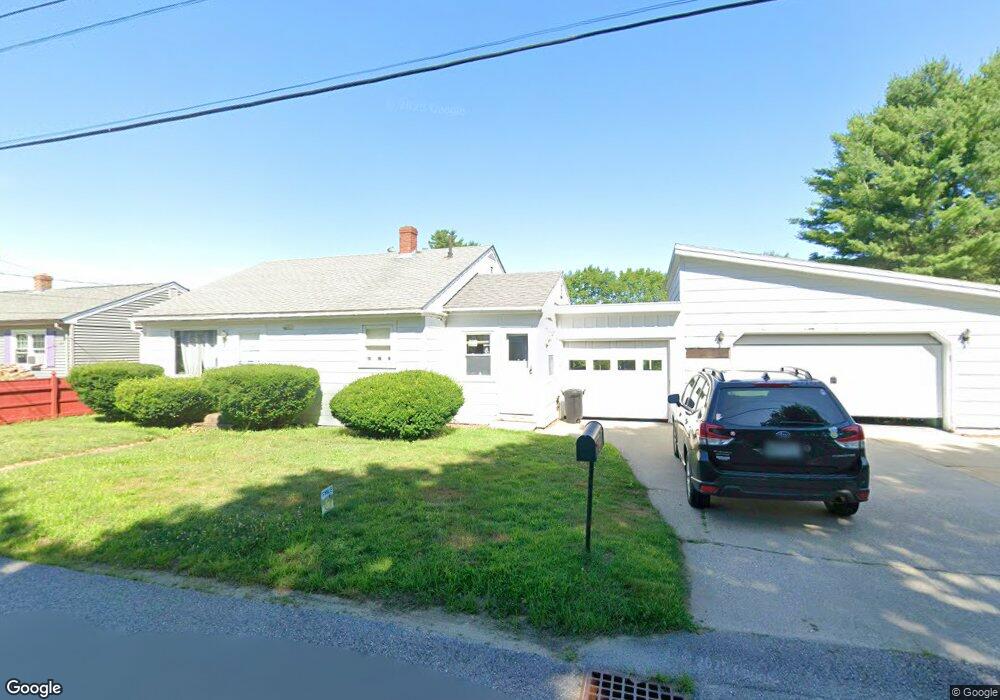
44 Jenkins St Lewiston, ME 04240
Estimated Value: $230,587 - $267,000
2
Beds
2
Baths
1,060
Sq Ft
$228/Sq Ft
Est. Value
About This Home
This home is located at 44 Jenkins St, Lewiston, ME 04240 and is currently estimated at $241,397, approximately $227 per square foot. 44 Jenkins St is a home located in Androscoggin County with nearby schools including Raymond A. Geiger Elementary School, Lewiston High School, and Spurwink-Lewiston/Auburn.
Ownership History
Date
Name
Owned For
Owner Type
Purchase Details
Closed on
May 10, 2010
Sold by
Stlaurent Laurent Est
Bought by
Cote Jeffrey A
Current Estimated Value
Home Financials for this Owner
Home Financials are based on the most recent Mortgage that was taken out on this home.
Original Mortgage
$112,891
Outstanding Balance
$74,252
Interest Rate
4.75%
Mortgage Type
FHA
Estimated Equity
$167,145
Create a Home Valuation Report for This Property
The Home Valuation Report is an in-depth analysis detailing your home's value as well as a comparison with similar homes in the area
Home Values in the Area
Average Home Value in this Area
Purchase History
| Date | Buyer | Sale Price | Title Company |
|---|---|---|---|
| Cote Jeffrey A | -- | -- |
Source: Public Records
Mortgage History
| Date | Status | Borrower | Loan Amount |
|---|---|---|---|
| Open | Cote Jeffrey A | $112,891 |
Source: Public Records
Tax History Compared to Growth
Tax History
| Year | Tax Paid | Tax Assessment Tax Assessment Total Assessment is a certain percentage of the fair market value that is determined by local assessors to be the total taxable value of land and additions on the property. | Land | Improvement |
|---|---|---|---|---|
| 2025 | $2,638 | $80,470 | $20,760 | $59,710 |
| 2024 | $2,557 | $80,470 | $20,760 | $59,710 |
| 2023 | $2,414 | $80,470 | $20,760 | $59,710 |
| 2022 | $2,293 | $80,470 | $20,760 | $59,710 |
| 2021 | $2,274 | $80,470 | $20,760 | $59,710 |
| 2020 | $2,307 | $80,470 | $20,760 | $59,710 |
| 2019 | $2,326 | $80,470 | $20,760 | $59,710 |
| 2018 | $2,307 | $80,470 | $20,760 | $59,710 |
| 2017 | $2,255 | $80,470 | $20,760 | $59,710 |
| 2016 | $2,216 | $80,470 | $20,760 | $59,710 |
| 2015 | $2,202 | $80,470 | $20,760 | $59,710 |
| 2014 | $2,140 | $80,470 | $20,760 | $59,710 |
| 2013 | $2,128 | $80,470 | $20,760 | $59,710 |
Source: Public Records
Map
Nearby Homes