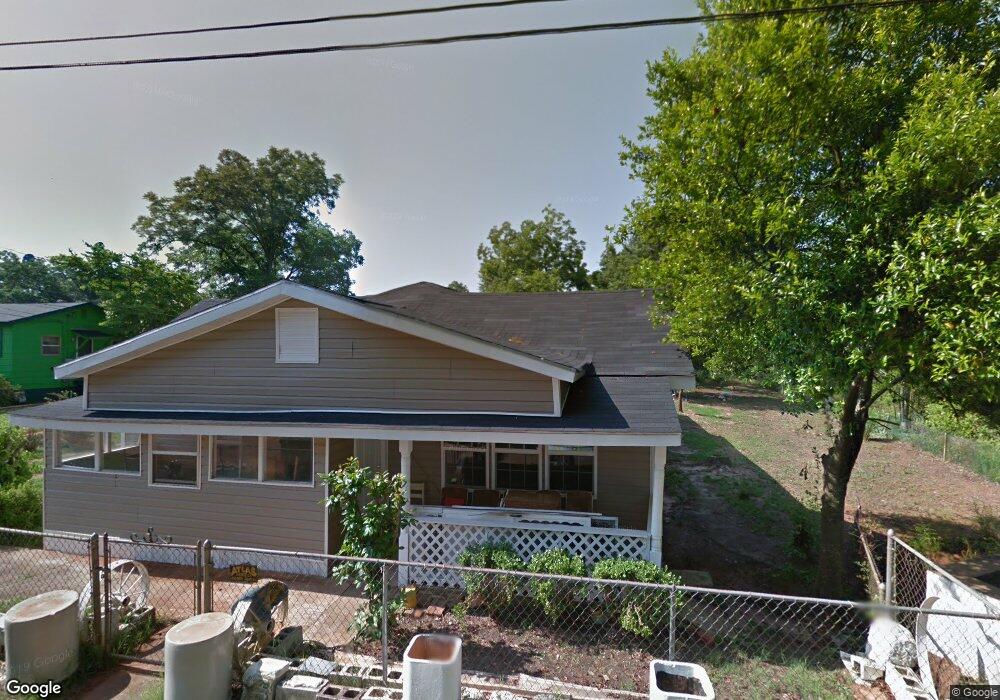
44 John Smith Ave Shellman, GA 39886
Estimated Value: $107,534 - $152,000
4
Beds
2
Baths
1,938
Sq Ft
$67/Sq Ft
Est. Value
About This Home
This home is located at 44 John Smith Ave, Shellman, GA 39886 and is currently estimated at $130,134, approximately $67 per square foot. 44 John Smith Ave is a home with nearby schools including Randolph County Elementary School, Randolph Clay Middle School, and Randolph Clay High School.
Ownership History
Date
Name
Owned For
Owner Type
Purchase Details
Closed on
Nov 24, 2020
Sold by
Beverly Tiny Maude
Bought by
Harris Daisha Beverly and Harris Beverly Connye
Current Estimated Value
Purchase Details
Closed on
Dec 14, 2012
Sold by
Beverly Hayes Tracie Teres
Bought by
Beverly Tiny Maude
Purchase Details
Closed on
Dec 9, 2012
Sold by
Beverly Connye C
Bought by
Beverly Tiny Maude
Purchase Details
Closed on
Dec 7, 2012
Sold by
Beverly Larry
Bought by
Beverly Tiny Maude
Purchase Details
Closed on
Dec 4, 2012
Sold by
Harris Daisha Alfreda Beve
Bought by
Beverly Tiny Maude
Purchase Details
Closed on
Jul 23, 1996
Bought by
Beverly Tiny Maude
Create a Home Valuation Report for This Property
The Home Valuation Report is an in-depth analysis detailing your home's value as well as a comparison with similar homes in the area
Home Values in the Area
Average Home Value in this Area
Purchase History
| Date | Buyer | Sale Price | Title Company |
|---|---|---|---|
| Harris Daisha Beverly | -- | -- | |
| Harris Daisha Beverly | -- | -- | |
| Beverly Tiny Maude | -- | -- | |
| Beverly Tiny Maude | -- | -- | |
| Beverly Tiny Maude | -- | -- | |
| Beverly Tiny Maude | -- | -- | |
| Beverly Tiny Maude | -- | -- | |
| Beverly Tiny Maude | -- | -- | |
| Beverly Tiny Maude | -- | -- | |
| Beverly Tiny Maude | -- | -- | |
| Beverly Tiny Maude | -- | -- | |
| Beverly Tiny Maude | -- | -- |
Source: Public Records
Tax History
| Year | Tax Paid | Tax Assessment Tax Assessment Total Assessment is a certain percentage of the fair market value that is determined by local assessors to be the total taxable value of land and additions on the property. | Land | Improvement |
|---|---|---|---|---|
| 2025 | $1,160 | $37,580 | $1,240 | $36,340 |
| 2024 | $1,194 | $34,220 | $1,120 | $33,100 |
| 2023 | $263 | $34,220 | $1,120 | $33,100 |
| 2022 | $587 | $34,220 | $1,120 | $33,100 |
| 2021 | $746 | $20,074 | $997 | $19,077 |
| 2020 | $331 | $20,074 | $997 | $19,077 |
| 2019 | $327 | $20,074 | $997 | $19,077 |
| 2018 | $950 | $20,074 | $997 | $19,077 |
| 2017 | $297 | $20,074 | $997 | $19,077 |
| 2016 | $297 | $20,074 | $997 | $19,077 |
| 2015 | -- | $20,074 | $997 | $19,077 |
| 2014 | -- | $14,514 | $623 | $13,892 |
| 2013 | -- | $12,189 | $622 | $11,566 |
Source: Public Records
Map
Nearby Homes
- 0 Carver St
- 3109 Calhoun St
- 48 Cheney St
- 3845 Pearl St
- 8369 Graves Hwy
- Sam Bentley Rd
- Pierce Rd
- 0 Bird Song Rd
- 00 Hwy 41
- 0 District Line Rd Unit 10518137
- 13XX Graves Hwy
- 300 Five Forks Rd
- 0 William Avera Rd
- 145 Pearson Dr SW
- 236 Gordon St SW
- 361/552 NW Tenth Ave
- 298 Nelson Coffin Dr
- 226 N Main St
- 411 E Lee St
- 414 2nd Ave SE
- 50 John Smith Ave
- 49 John Smith Ave
- 61 John Smith Ave
- 82 John Smith Ave
- 58 Buford St
- 66 Buford St
- 84 Buford St
- 106 Buford St
- 75 Buford St
- 24 Buford St
- 22 Bethea Dr
- 102 John Smith Ave
- 106 John Smith Ave
- 12 Bethea Dr
- 120 Buford St
- 41 Bethea Dr
- 19 Buford St
- 3436 Fountain Bridge Rd
- 2911 Calhoun St
- 91 Bethea Dr
Your Personal Tour Guide
Ask me questions while you tour the home.