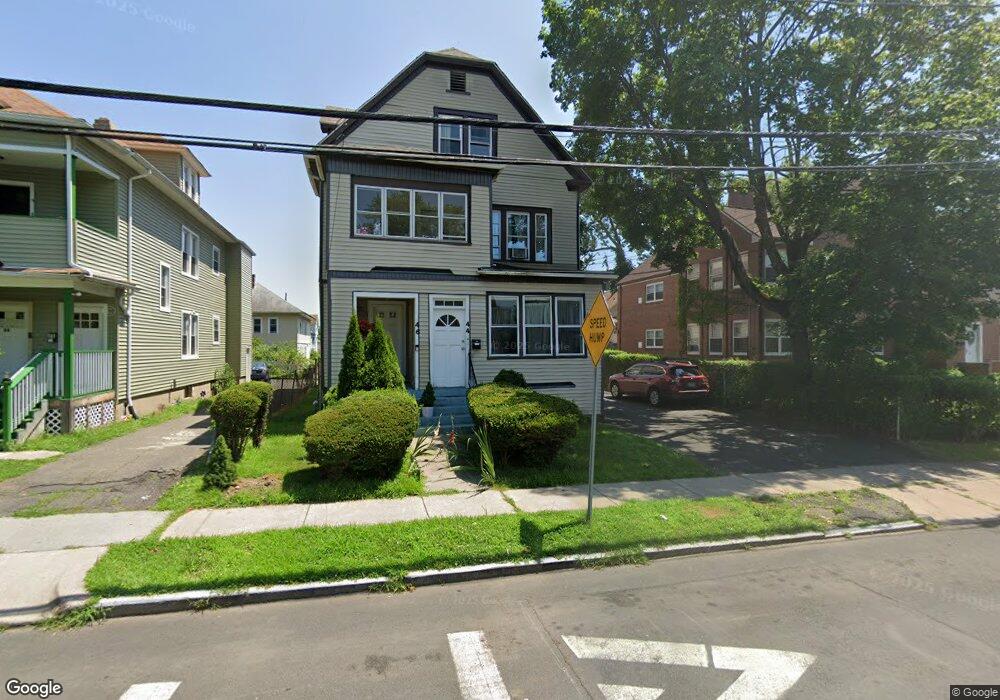
44 Kent St Unit 3 Hartford, CT 06112
Upper Albany NeighborhoodEstimated Value: $383,000 - $418,000
6
Beds
3
Baths
3,149
Sq Ft
$127/Sq Ft
Est. Value
About This Home
This home is located at 44 Kent St Unit 3, Hartford, CT 06112 and is currently estimated at $398,693, approximately $126 per square foot. 44 Kent St Unit 3 is a home located in Hartford County with nearby schools including Rawson School, Noah Webster Micro Society School, and McKinley School.
Ownership History
Date
Name
Owned For
Owner Type
Purchase Details
Closed on
Aug 31, 2023
Sold by
Scarlett Cyril
Bought by
Eugene Mary T
Current Estimated Value
Home Financials for this Owner
Home Financials are based on the most recent Mortgage that was taken out on this home.
Original Mortgage
$318,500
Outstanding Balance
$310,930
Interest Rate
6.81%
Mortgage Type
Purchase Money Mortgage
Estimated Equity
$87,763
Purchase Details
Closed on
Oct 3, 2018
Sold by
Officer Cecil E
Bought by
Scarlett Cyril
Home Financials for this Owner
Home Financials are based on the most recent Mortgage that was taken out on this home.
Original Mortgage
$147,250
Interest Rate
4.5%
Mortgage Type
Credit Line Revolving
Purchase Details
Closed on
May 22, 2008
Sold by
44-46 Kent Street Llc
Bought by
Officer Cecil
Create a Home Valuation Report for This Property
The Home Valuation Report is an in-depth analysis detailing your home's value as well as a comparison with similar homes in the area
Home Values in the Area
Average Home Value in this Area
Purchase History
| Date | Buyer | Sale Price | Title Company |
|---|---|---|---|
| Eugene Mary T | $350,000 | None Available | |
| Scarlett Cyril | $155,000 | -- | |
| Officer Cecil | $200,000 | -- |
Source: Public Records
Mortgage History
| Date | Status | Borrower | Loan Amount |
|---|---|---|---|
| Open | Eugene Mary T | $318,500 | |
| Previous Owner | Officer Cecil | $147,250 | |
| Previous Owner | Officer Cecil | $3,100 | |
| Previous Owner | Officer Cecil | $150,450 |
Source: Public Records
Tax History Compared to Growth
Tax History
| Year | Tax Paid | Tax Assessment Tax Assessment Total Assessment is a certain percentage of the fair market value that is determined by local assessors to be the total taxable value of land and additions on the property. | Land | Improvement |
|---|---|---|---|---|
| 2025 | $6,069 | $88,016 | $5,807 | $82,209 |
| 2024 | $6,069 | $88,016 | $5,807 | $82,209 |
| 2023 | $6,069 | $88,016 | $5,807 | $82,209 |
| 2022 | $6,069 | $88,017 | $5,807 | $82,210 |
| 2021 | $4,197 | $56,490 | $6,860 | $49,630 |
| 2020 | $4,197 | $56,490 | $6,860 | $49,630 |
| 2019 | $4,197 | $56,490 | $6,860 | $49,630 |
| 2018 | $4,055 | $54,585 | $6,628 | $47,957 |
| 2016 | $3,642 | $49,024 | $6,314 | $42,710 |
| 2015 | $3,469 | $46,695 | $6,013 | $40,682 |
| 2014 | $3,384 | $45,553 | $5,866 | $39,687 |
Source: Public Records
Map
Nearby Homes
- 103 Baltimore St
- 138 Kent St Unit 140
- 131-135,137-145,119- Albany Ave
- 364 Woodland St
- 109 Blue Hills Ave
- 111 Westbourne Pkwy Unit 113
- 4 Deerfield Ave
- 8 Sterling St
- 68 Sterling St Unit 70
- 290 Sargeant St Unit 292
- 78-80 Cabot St
- 25 Cornwall St
- 175 Scarborough St
- 240 Sargeant St
- 141 Greenfield St
- 52 Atwood St Unit 3B
- 25 May St
- 62 Burton St
- 275 Kenyon St
- 10 Burton St Unit 12
- 44 Kent St Unit 46
- 48 Kent St Unit 50
- 40 Kent St Unit 42
- 36 Kent St Unit 38
- 52 Kent St Unit 54
- 38 Kent St
- 49 Adams St Unit 51
- 57 Adams St Unit 59
- 37 Kent St Unit 39
- 56 Kent St Unit 58
- 53 Adams St Unit 55
- 61 Adams St Unit 63
- 41 Kent St
- 35 Kent St Unit 2ND F
- 35 Kent St
- 45 Kent St
- 45 Adams St Unit 47
- 49 Kent St Unit 51
- 41 Adams St