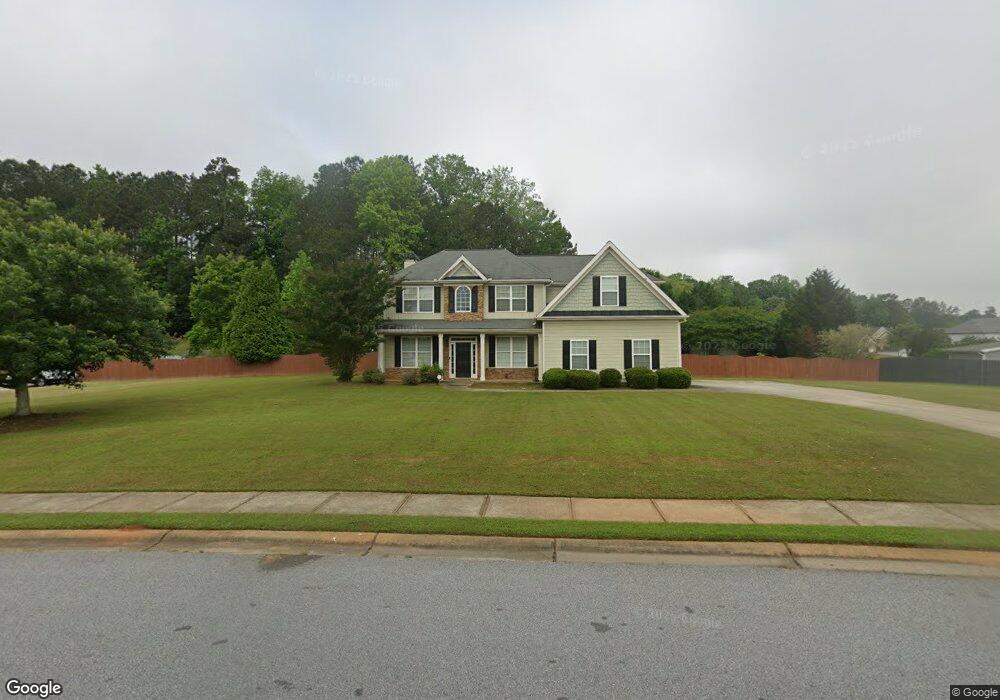
44 Lake Zachary Dr Unit 79 Newnan, GA 30265
Estimated Value: $375,000 - $574,000
4
Beds
3
Baths
3,499
Sq Ft
$139/Sq Ft
Est. Value
About This Home
This home is located at 44 Lake Zachary Dr Unit 79, Newnan, GA 30265 and is currently estimated at $487,470, approximately $139 per square foot. 44 Lake Zachary Dr Unit 79 is a home located in Coweta County with nearby schools including Arbor Springs Elementary School, Madras Middle School, and Northgate High School.
Ownership History
Date
Name
Owned For
Owner Type
Purchase Details
Closed on
Feb 1, 2017
Sold by
Brauer Craig T
Bought by
Rooks Clarisa
Current Estimated Value
Home Financials for this Owner
Home Financials are based on the most recent Mortgage that was taken out on this home.
Original Mortgage
$295,075
Outstanding Balance
$243,722
Interest Rate
4.2%
Mortgage Type
New Conventional
Estimated Equity
$243,748
Purchase Details
Closed on
Oct 4, 2013
Sold by
Scott James J
Bought by
Brauer Craig T and Brauer Kim
Home Financials for this Owner
Home Financials are based on the most recent Mortgage that was taken out on this home.
Original Mortgage
$231,920
Interest Rate
3.62%
Mortgage Type
New Conventional
Purchase Details
Closed on
Dec 6, 2004
Sold by
Holloway Bobby L
Bought by
Cottonwood Developers Inc
Purchase Details
Closed on
Mar 31, 1984
Bought by
Holloway Bobby L
Create a Home Valuation Report for This Property
The Home Valuation Report is an in-depth analysis detailing your home's value as well as a comparison with similar homes in the area
Home Values in the Area
Average Home Value in this Area
Purchase History
| Date | Buyer | Sale Price | Title Company |
|---|---|---|---|
| Rooks Clarisa | $145,000 | -- | |
| Rooks Clarisa | $145,000 | -- | |
| Brauer Craig T | $289,900 | -- | |
| Cottonwood Developers Inc | $480,000 | -- | |
| Holloway Bobby L | -- | -- |
Source: Public Records
Mortgage History
| Date | Status | Borrower | Loan Amount |
|---|---|---|---|
| Open | Rooks Clarisa | $295,075 | |
| Closed | Rooks Clarisa | $295,075 | |
| Previous Owner | Brauer Craig T | $231,920 |
Source: Public Records
Tax History Compared to Growth
Tax History
| Year | Tax Paid | Tax Assessment Tax Assessment Total Assessment is a certain percentage of the fair market value that is determined by local assessors to be the total taxable value of land and additions on the property. | Land | Improvement |
|---|---|---|---|---|
| 2024 | $3,904 | $172,771 | $30,000 | $142,771 |
| 2023 | $3,904 | $179,022 | $22,000 | $157,022 |
| 2022 | $3,728 | $156,046 | $22,000 | $134,046 |
| 2021 | $3,468 | $136,396 | $18,000 | $118,396 |
| 2020 | $3,490 | $136,396 | $18,000 | $118,396 |
| 2019 | $3,508 | $124,669 | $20,000 | $104,669 |
| 2018 | $3,261 | $124,669 | $20,000 | $104,669 |
| 2017 | $3,654 | $124,669 | $20,000 | $104,669 |
| 2016 | $3,506 | $121,078 | $20,000 | $101,078 |
| 2015 | $3,192 | $112,100 | $20,000 | $92,100 |
| 2014 | $2,597 | $97,816 | $12,000 | $85,816 |
Source: Public Records
Map
Nearby Homes
- 54 Long Shore Way
- LOT 2 Raymond Hill Rd
- 26 Brooke Ct Unit 7
- 7 River Park Way
- 419 Long Shore Way
- 851 Raymond Hill Rd
- 207 River Park Dr
- 972 Raymond Hill Rd
- 306 Northgate Preserve Dr
- 273 George Coggin Rd
- 495 George Coggin Rd
- 319 Le Paradis Blvd
- 46 I W Brooks Rd
- 127 Northgate Preserve Dr
- 45 Meadow View Glen
- 30 Stony Ridge Point
- 55 Grange Ct
- 15 Greenridge Way
- 131 Cannongate Cir
- 68 Vale Point
- 44 Lake Zachary Dr
- 0 Lake Zachary Dr Unit 7136336
- 0 Lake Zachary Dr Unit 3271384
- 0 Lake Zachary Dr
- 30 Lake Zachary Dr
- 64 Lake Zachary Dr
- 68 Blake Ridge
- 80 Blake Ridge
- 33 Lake Zachary Dr
- 112 Long Shore Way
- 51 Lake Zachary Dr
- 10 Lake Zachary Dr
- 84 Long Shore Way
- 0 Blake Ridge Unit 8695295
- 0 Blake Ridge Unit 8611189
- 0 Blake Ridge Unit 3223644
- 0 Blake Ridge Unit 3191778
- 0 Blake Ridge Unit 7234837
- 0 Blake Ridge Unit 7270141
- 0 Blake Ridge