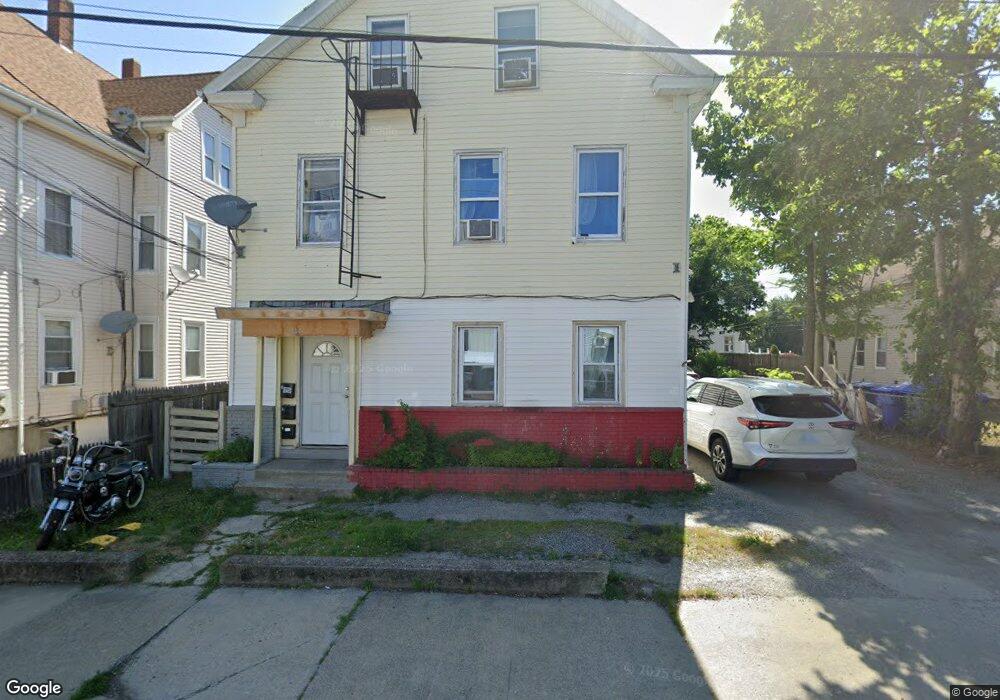
44 Mulberry St Pawtucket, RI 02860
Downtown Pawtucket NeighborhoodEstimated Value: $622,000 - $648,000
11
Beds
4
Baths
3,590
Sq Ft
$177/Sq Ft
Est. Value
About This Home
This home is located at 44 Mulberry St, Pawtucket, RI 02860 and is currently estimated at $635,000, approximately $176 per square foot. 44 Mulberry St is a home located in Providence County with nearby schools including International Charter School, Blackstone Academy Charter School, and Saint Raphael Academy.
Ownership History
Date
Name
Owned For
Owner Type
Purchase Details
Closed on
Nov 1, 2024
Sold by
Gil Reyes
Bought by
Gil Laura M
Current Estimated Value
Purchase Details
Closed on
Apr 25, 2011
Sold by
Fnma
Bought by
Gil Reyes
Purchase Details
Closed on
Feb 22, 2011
Sold by
Cummings Kevin J and Cummings Catherine
Bought by
Fhlmc
Purchase Details
Closed on
Aug 3, 2010
Sold by
Cummings Kevin J and Cummings Catherine
Bought by
Fhlmc
Create a Home Valuation Report for This Property
The Home Valuation Report is an in-depth analysis detailing your home's value as well as a comparison with similar homes in the area
Home Values in the Area
Average Home Value in this Area
Purchase History
| Date | Buyer | Sale Price | Title Company |
|---|---|---|---|
| Gil Laura M | -- | None Available | |
| Gil Laura M | -- | None Available | |
| Gil Reyes | $57,000 | -- | |
| Fhlmc | $140,000 | -- | |
| Fhlmc | $255,000 | -- | |
| Gil Reyes | $57,000 | -- | |
| Fhlmc | $140,000 | -- | |
| Fhlmc | $255,000 | -- |
Source: Public Records
Mortgage History
| Date | Status | Borrower | Loan Amount |
|---|---|---|---|
| Previous Owner | Fhlmc | $304,000 | |
| Previous Owner | Fhlmc | $63,000 |
Source: Public Records
Tax History Compared to Growth
Tax History
| Year | Tax Paid | Tax Assessment Tax Assessment Total Assessment is a certain percentage of the fair market value that is determined by local assessors to be the total taxable value of land and additions on the property. | Land | Improvement |
|---|---|---|---|---|
| 2025 | $6,216 | $472,700 | $72,800 | $399,900 |
| 2024 | $5,833 | $472,700 | $72,800 | $399,900 |
| 2023 | $5,870 | $346,500 | $40,400 | $306,100 |
| 2022 | $5,745 | $346,500 | $40,400 | $306,100 |
| 2021 | $5,745 | $346,500 | $40,400 | $306,100 |
| 2020 | $5,181 | $248,000 | $53,900 | $194,100 |
| 2019 | $5,181 | $248,000 | $53,900 | $194,100 |
| 2018 | $4,992 | $248,000 | $53,900 | $194,100 |
| 2017 | $4,492 | $197,700 | $52,700 | $145,000 |
| 2016 | $4,822 | $220,300 | $52,700 | $167,600 |
| 2015 | $4,822 | $220,300 | $52,700 | $167,600 |
| 2014 | $4,026 | $174,600 | $52,700 | $121,900 |
Source: Public Records
Map
Nearby Homes