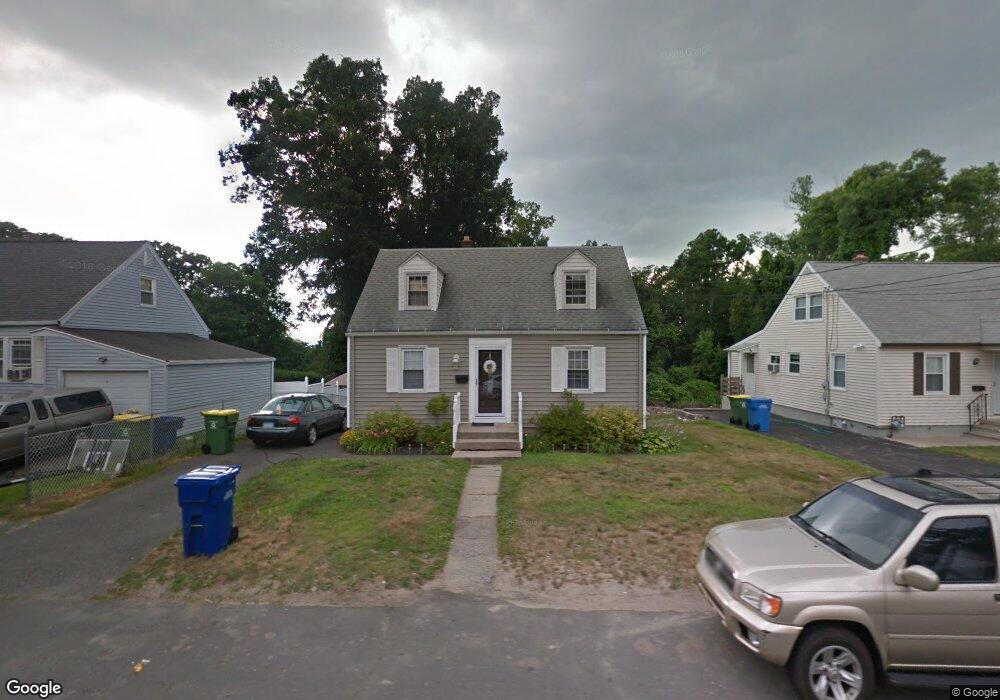
44 Myrna Ave Waterbury, CT 06704
North End District NeighborhoodEstimated Value: $194,000 - $259,753
2
Beds
1
Bath
1,080
Sq Ft
$220/Sq Ft
Est. Value
About This Home
This home is located at 44 Myrna Ave, Waterbury, CT 06704 and is currently estimated at $237,188, approximately $219 per square foot. 44 Myrna Ave is a home located in New Haven County with nearby schools including F. J. Kingsbury School, North End Middle School, and Wilby High School.
Ownership History
Date
Name
Owned For
Owner Type
Purchase Details
Closed on
May 22, 2006
Sold by
Res Rehabilitation
Bought by
Kee Cheryl L
Current Estimated Value
Home Financials for this Owner
Home Financials are based on the most recent Mortgage that was taken out on this home.
Original Mortgage
$152,900
Outstanding Balance
$88,654
Interest Rate
6.42%
Mortgage Type
Purchase Money Mortgage
Estimated Equity
$148,534
Purchase Details
Closed on
Jan 30, 1998
Sold by
Rayno John R and Rayno Joyce M
Bought by
Fenwick John R and Fenwick Heather M
Home Financials for this Owner
Home Financials are based on the most recent Mortgage that was taken out on this home.
Original Mortgage
$54,012
Interest Rate
7.02%
Mortgage Type
Purchase Money Mortgage
Purchase Details
Closed on
Feb 14, 1995
Sold by
Berkeley Fed B & T
Bought by
Rayno John and Rayno Joyce
Create a Home Valuation Report for This Property
The Home Valuation Report is an in-depth analysis detailing your home's value as well as a comparison with similar homes in the area
Home Values in the Area
Average Home Value in this Area
Purchase History
| Date | Buyer | Sale Price | Title Company |
|---|---|---|---|
| Kee Cheryl L | $169,900 | -- | |
| Fenwick John R | $58,000 | -- | |
| Rayno John | $54,000 | -- | |
| Berkeley Fed B & T | $41,000 | -- |
Source: Public Records
Mortgage History
| Date | Status | Borrower | Loan Amount |
|---|---|---|---|
| Open | Berkeley Fed B & T | $152,900 | |
| Previous Owner | Berkeley Fed B & T | $73,170 | |
| Previous Owner | Berkeley Fed B & T | $85,500 | |
| Previous Owner | Berkeley Fed B & T | $54,012 |
Source: Public Records
Tax History Compared to Growth
Tax History
| Year | Tax Paid | Tax Assessment Tax Assessment Total Assessment is a certain percentage of the fair market value that is determined by local assessors to be the total taxable value of land and additions on the property. | Land | Improvement |
|---|---|---|---|---|
| 2025 | $4,468 | $99,330 | $19,180 | $80,150 |
| 2024 | $4,911 | $99,330 | $19,180 | $80,150 |
| 2023 | $5,383 | $99,330 | $19,180 | $80,150 |
| 2022 | $3,631 | $60,310 | $19,210 | $41,100 |
| 2021 | $3,631 | $60,310 | $19,210 | $41,100 |
| 2020 | $3,631 | $60,310 | $19,210 | $41,100 |
| 2019 | $3,631 | $60,310 | $19,210 | $41,100 |
| 2018 | $3,631 | $60,310 | $19,210 | $41,100 |
| 2017 | $3,894 | $64,680 | $19,210 | $45,470 |
| 2016 | $3,894 | $64,680 | $19,210 | $45,470 |
| 2015 | $3,766 | $64,680 | $19,210 | $45,470 |
| 2014 | $3,766 | $64,680 | $19,210 | $45,470 |
Source: Public Records
Map
Nearby Homes