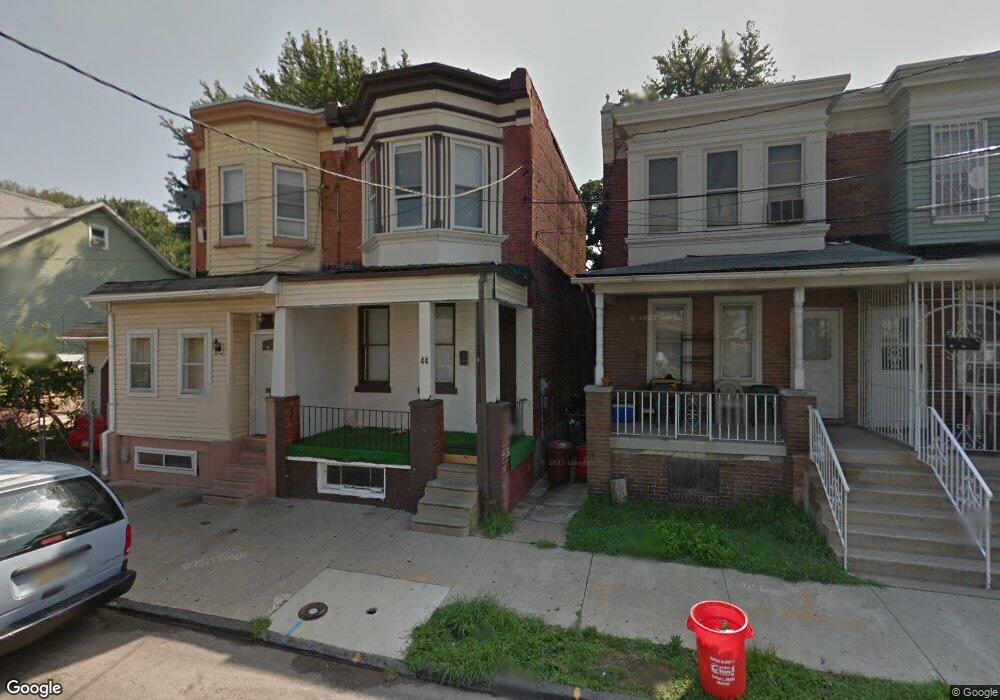
44 N 21st St Camden, NJ 08105
Dudley NeighborhoodEstimated Value: $92,124 - $158,000
--
Bed
--
Bath
1,104
Sq Ft
$115/Sq Ft
Est. Value
About This Home
This home is located at 44 N 21st St, Camden, NJ 08105 and is currently estimated at $126,531, approximately $114 per square foot. 44 N 21st St is a home located in Camden County with nearby schools including Veterans Memorial Middle School, Eastside High School, and St Joseph Pro-Cathedral School.
Ownership History
Date
Name
Owned For
Owner Type
Purchase Details
Closed on
Jun 6, 2023
Sold by
Alcazar Consuelo
Bought by
Santana-Aquino Jose C
Current Estimated Value
Home Financials for this Owner
Home Financials are based on the most recent Mortgage that was taken out on this home.
Original Mortgage
$176,641
Outstanding Balance
$172,077
Interest Rate
6.79%
Estimated Equity
-$45,546
Purchase Details
Closed on
Nov 21, 2017
Sold by
Kenwood 1437 Corp
Bought by
Camden Realty Llc
Create a Home Valuation Report for This Property
The Home Valuation Report is an in-depth analysis detailing your home's value as well as a comparison with similar homes in the area
Home Values in the Area
Average Home Value in this Area
Purchase History
| Date | Buyer | Sale Price | Title Company |
|---|---|---|---|
| Santana-Aquino Jose C | $179,900 | Brennan Title Abstract | |
| Camden Realty Llc | -- | Presidential Title Agency In |
Source: Public Records
Mortgage History
| Date | Status | Borrower | Loan Amount |
|---|---|---|---|
| Open | Santana-Aquino Jose C | $176,641 |
Source: Public Records
Tax History Compared to Growth
Tax History
| Year | Tax Paid | Tax Assessment Tax Assessment Total Assessment is a certain percentage of the fair market value that is determined by local assessors to be the total taxable value of land and additions on the property. | Land | Improvement |
|---|---|---|---|---|
| 2025 | $1,470 | $41,500 | $7,800 | $33,700 |
| 2024 | $1,421 | $41,500 | $7,800 | $33,700 |
| 2023 | $1,421 | $41,500 | $7,800 | $33,700 |
| 2022 | $1,395 | $41,500 | $7,800 | $33,700 |
| 2021 | $1,390 | $41,500 | $7,800 | $33,700 |
| 2020 | $1,320 | $41,500 | $7,800 | $33,700 |
| 2019 | $1,264 | $41,500 | $7,800 | $33,700 |
| 2018 | $1,257 | $41,500 | $7,800 | $33,700 |
| 2017 | $1,226 | $41,500 | $7,800 | $33,700 |
| 2016 | $1,187 | $41,500 | $7,800 | $33,700 |
| 2015 | $1,143 | $41,500 | $7,800 | $33,700 |
| 2014 | $1,116 | $41,500 | $7,800 | $33,700 |
Source: Public Records
Map
Nearby Homes
- 2112 Howell St
- 127 N 23rd St
- 41 N 24th St
- 32 N 25th St
- 2621 Westfield Ave
- 2707 Westfield Ave
- 2709 Westfield Ave
- 901 N 19th St
- 902 N 19th St
- 2598 Baird Blvd
- 100 E 28th St
- 2817 Thompson St
- 2817 Westfield Ave
- 403 N 29th St
- 909 N 24th St
- 818 N 27th St
- 154 Eutaw Ave
- 908 N 24th St
- 2934 Cramer St
- 2818 Cleveland Ave