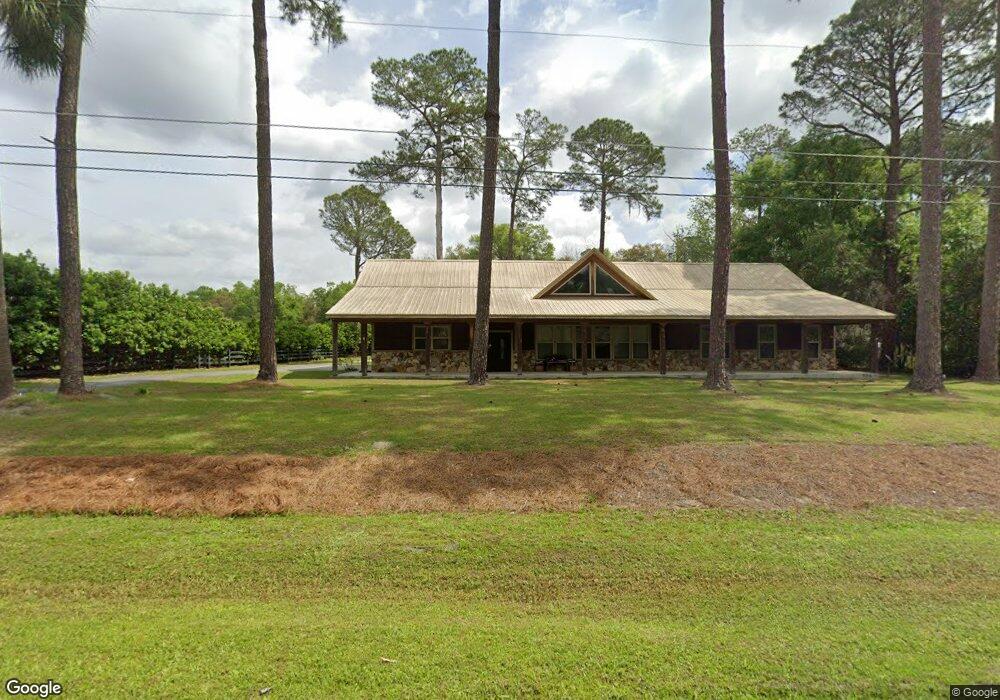
44 N Pecan St Lakeland, GA 31635
Estimated Value: $341,000 - $397,784
3
Beds
4
Baths
3,200
Sq Ft
$114/Sq Ft
Est. Value
About This Home
This home is located at 44 N Pecan St, Lakeland, GA 31635 and is currently estimated at $363,696, approximately $113 per square foot. 44 N Pecan St is a home located in Lanier County with nearby schools including Lanier County Elementary School, Lanier County Middle School, and Lanier County High School.
Ownership History
Date
Name
Owned For
Owner Type
Purchase Details
Closed on
Oct 14, 2022
Sold by
Hunt Brian Shannon
Bought by
Geers Justin L and Geers Heather D
Current Estimated Value
Home Financials for this Owner
Home Financials are based on the most recent Mortgage that was taken out on this home.
Original Mortgage
$331,520
Outstanding Balance
$318,975
Interest Rate
6.02%
Mortgage Type
VA
Estimated Equity
$44,721
Purchase Details
Closed on
Sep 16, 2020
Sold by
Hunt Emily Elizabeth
Bought by
Hunt Brian Shannon
Purchase Details
Closed on
Apr 17, 2013
Sold by
Tillman David Wayne
Bought by
Hunt Brian Shannon and Hunt Emily Elizabeth
Purchase Details
Closed on
Nov 18, 2010
Sold by
Scibeck Lawrence K
Bought by
Tillman David Wayne
Purchase Details
Closed on
Sep 10, 2007
Sold by
Sec Of Housing & U
Bought by
Scibeck Lawrence K
Purchase Details
Closed on
Nov 7, 2006
Sold by
Wells Fargo Bank
Bought by
Sec Of Housing & Urban
Create a Home Valuation Report for This Property
The Home Valuation Report is an in-depth analysis detailing your home's value as well as a comparison with similar homes in the area
Home Values in the Area
Average Home Value in this Area
Purchase History
| Date | Buyer | Sale Price | Title Company |
|---|---|---|---|
| Geers Justin L | $320,000 | -- | |
| Hunt Brian Shannon | -- | -- | |
| Hunt Brian Shannon | $160,000 | -- | |
| Tillman David Wayne | $30,000 | -- | |
| Scibeck Lawrence K | $59,160 | -- | |
| Sec Of Housing & Urban | -- | -- | |
| Wells Fargo Bank | -- | -- |
Source: Public Records
Mortgage History
| Date | Status | Borrower | Loan Amount |
|---|---|---|---|
| Open | Geers Justin L | $331,520 |
Source: Public Records
Tax History Compared to Growth
Tax History
| Year | Tax Paid | Tax Assessment Tax Assessment Total Assessment is a certain percentage of the fair market value that is determined by local assessors to be the total taxable value of land and additions on the property. | Land | Improvement |
|---|---|---|---|---|
| 2024 | $6,043 | $167,800 | $5,360 | $162,440 |
| 2023 | $4,383 | $100,656 | $5,360 | $95,296 |
| 2022 | $4,383 | $100,656 | $5,360 | $95,296 |
| 2021 | $4,459 | $100,656 | $5,360 | $95,296 |
| 2020 | $4,494 | $100,656 | $5,360 | $95,296 |
| 2019 | $4,492 | $100,656 | $5,360 | $95,296 |
| 2018 | $4,494 | $100,656 | $5,360 | $95,296 |
| 2017 | $4,499 | $100,656 | $5,360 | $95,296 |
| 2016 | $4,592 | $101,308 | $4,800 | $96,508 |
| 2015 | -- | $101,868 | $5,360 | $96,508 |
| 2014 | -- | $93,428 | $5,360 | $88,068 |
| 2013 | -- | $64,068 | $5,360 | $58,708 |
Source: Public Records
Map
Nearby Homes
- 94 W Thigpen Ave
- 62 N Temple St
- 425+/- Georgia 135
- 152 W Main St
- 13 W Lee Ave
- 9 Pine Breeze Ct
- 14 W Johnson Ave
- 83 E Howell Dr
- 0 Old Nashville Rd
- 201 W Highway 37
- 33 E Peeler Ave
- 111 E Bostick Ave
- 10 S Williams St
- 281 U S 221
- 0 Patten Ln
- 20 River Rd
- TBT River Rd
- 7.97 ac Boyette Rd
- 472 S Hwy 135
- 261 River Rd
- 38 N Pecan St
- 45 N Pecan St
- 39 N Pecan St
- 411 N Pecan St
- 49 N Pecan St
- 11 N Lakeshore Dr
- 34 N Pecan St
- 7 N Lakeshore Dr
- 35 N Pecan St
- 412 N Pecan St
- 53 N Pecan St
- 29 N Pecan St
- 408 N Pecan St
- 19 N Lakeshore Dr
- 23 N Lakeshore Dr
- 27 N Lakeshore Dr
- 63 N Pecan St
- 25 N Pecan St
- 11 E Chestnut Ave
- 33 N Lakeshore Dr