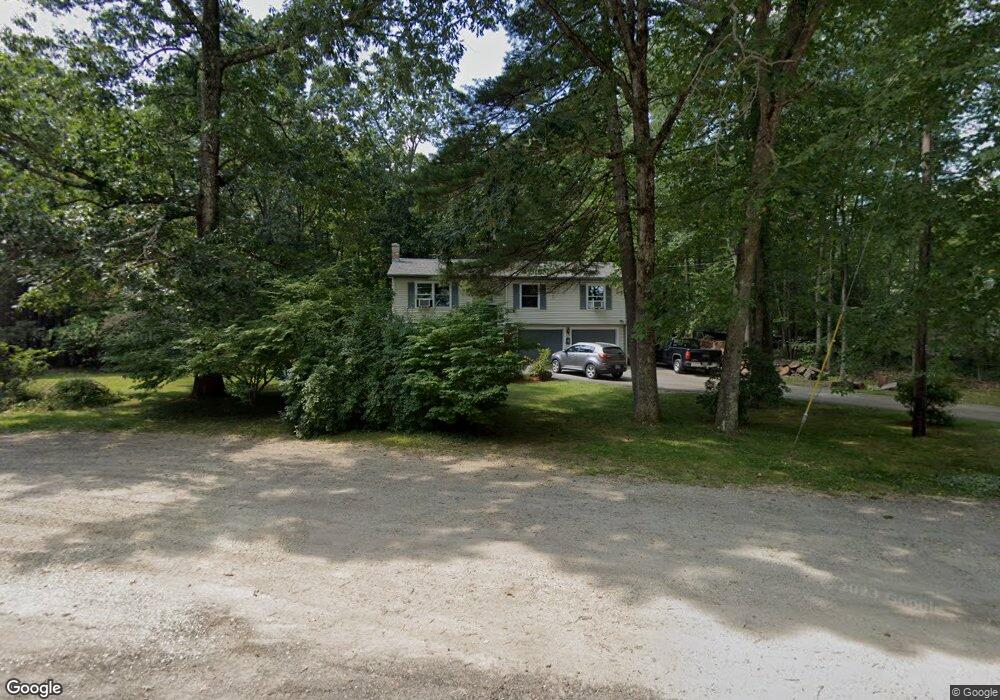
44 Oak Ridge Dr Charlton, MA 01507
Estimated Value: $455,000 - $485,751
3
Beds
2
Baths
1,452
Sq Ft
$326/Sq Ft
Est. Value
About This Home
This home is located at 44 Oak Ridge Dr, Charlton, MA 01507 and is currently estimated at $472,938, approximately $325 per square foot. 44 Oak Ridge Dr is a home located in Worcester County with nearby schools including Shepherd Hill Regional High School, Trinity Catholic Academy, and ViewPoint Christian Academy.
Ownership History
Date
Name
Owned For
Owner Type
Purchase Details
Closed on
Sep 11, 2008
Sold by
Indymac Bk
Bought by
Stanikmas Scott D
Current Estimated Value
Home Financials for this Owner
Home Financials are based on the most recent Mortgage that was taken out on this home.
Original Mortgage
$167,900
Outstanding Balance
$111,083
Interest Rate
6.58%
Mortgage Type
Purchase Money Mortgage
Estimated Equity
$361,855
Purchase Details
Closed on
Apr 2, 2008
Sold by
Sergel Albert and Indymac Bk
Bought by
Indymac Bk
Purchase Details
Closed on
Apr 15, 2005
Sold by
Green Barrie W and Green Rita C
Bought by
Sergel Albert and Sergel Debra L
Home Financials for this Owner
Home Financials are based on the most recent Mortgage that was taken out on this home.
Original Mortgage
$56,400
Interest Rate
5.78%
Mortgage Type
Purchase Money Mortgage
Purchase Details
Closed on
Jan 30, 1996
Sold by
Piette Stephen J
Bought by
Green Barrie and Green Rita
Create a Home Valuation Report for This Property
The Home Valuation Report is an in-depth analysis detailing your home's value as well as a comparison with similar homes in the area
Home Values in the Area
Average Home Value in this Area
Purchase History
| Date | Buyer | Sale Price | Title Company |
|---|---|---|---|
| Stanikmas Scott D | $182,900 | -- | |
| Stanikmas Scott D | $182,900 | -- | |
| Indymac Bk | $245,250 | -- | |
| Indymac Bk | $245,250 | -- | |
| Sergel Albert | $282,000 | -- | |
| Sergel Albert | $282,000 | -- | |
| Green Barrie | $120,000 | -- | |
| Green Barrie | $120,000 | -- |
Source: Public Records
Mortgage History
| Date | Status | Borrower | Loan Amount |
|---|---|---|---|
| Open | Stanikmas Scott D | $167,900 | |
| Closed | Green Barrie | $167,900 | |
| Previous Owner | Sergel Albert | $56,400 |
Source: Public Records
Tax History Compared to Growth
Tax History
| Year | Tax Paid | Tax Assessment Tax Assessment Total Assessment is a certain percentage of the fair market value that is determined by local assessors to be the total taxable value of land and additions on the property. | Land | Improvement |
|---|---|---|---|---|
| 2025 | $4,373 | $392,900 | $106,100 | $286,800 |
| 2024 | $4,239 | $373,800 | $100,900 | $272,900 |
| 2023 | $4,059 | $333,500 | $90,600 | $242,900 |
| 2022 | $3,758 | $282,800 | $82,800 | $200,000 |
| 2021 | $3,581 | $238,600 | $77,600 | $161,000 |
| 2020 | $3,565 | $238,600 | $77,600 | $161,000 |
| 2019 | $3,524 | $238,600 | $77,600 | $161,000 |
| 2018 | $3,021 | $223,800 | $77,600 | $146,200 |
| 2017 | $2,702 | $191,600 | $65,000 | $126,600 |
| 2016 | $2,640 | $191,600 | $65,000 | $126,600 |
| 2015 | $2,571 | $191,600 | $65,000 | $126,600 |
| 2014 | $2,481 | $196,000 | $65,000 | $131,000 |
Source: Public Records
Map
Nearby Homes
- 10 Harrington Rd
- Lot 7 Harrington Rd
- 0 Blood Rd
- 91 Burlingame Rd
- 86 Berry Corner Rd
- 876 Worcester St
- 149 Berry Corner Rd
- 133 Dresser Hill Rd
- Lot B1 Sampson Rd
- Lot B2 Sampson Rd
- 29 Sampson Rd
- 28 Southbridge Rd Unit 402
- 0 Sandersdale Rd
- 68 - 74 Sturbridge Rd
- 9 Piehl Dr
- Lot 1A Sandersdale Rd
- Lot 3A Sandersdale Rd
- Lot 2A Sandersdale Rd
- 0 Worcester Rd
- 6 S Sullivan Rd
- 41 Oak Ridge Dr
- 39 Oak Ridge Dr
- 38 Oak Ridge Dr
- 37 Oak Ridge Dr
- 36 Oak Ridge Dr
- 35 Oak Ridge Dr
- 34 Oak Ridge Dr
- 33 Oak Ridge Dr
- 30 Oak Ridge Dr
- 29 Oak Ridge Dr
- 21 Oak Ridge Dr
- 7 Oak Ridge Dr
- 19 Oak Ridge Dr
- 5 Oak Ridge Dr
- Lot 4 Oak Ridge Dr
- 9 Oak Ridge Dr
- 17 Oak Ridge Dr
- 17A Oak Ridge Dr
- 17A Oak Ridge Dr
- 15 Oak Ridge Dr