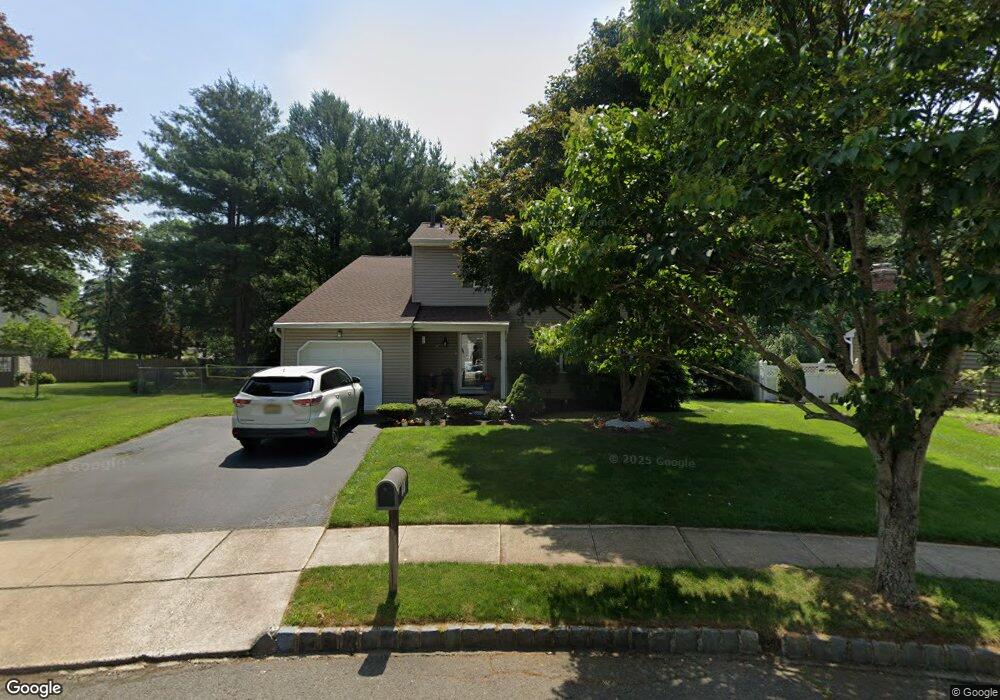
44 Overhill Rd East Brunswick, NJ 08816
Estimated Value: $595,514 - $844,000
--
Bed
--
Bath
2,430
Sq Ft
$303/Sq Ft
Est. Value
About This Home
This home is located at 44 Overhill Rd, East Brunswick, NJ 08816 and is currently estimated at $735,379, approximately $302 per square foot. 44 Overhill Rd is a home located in Middlesex County with nearby schools including Bowne-Munro Elementary School, Hammarskjold Upper Elementary School, and Churchill Junior High School.
Ownership History
Date
Name
Owned For
Owner Type
Purchase Details
Closed on
Jul 25, 2017
Sold by
Barry Kevin and Barry Linda
Bought by
Shah Nirmal P and Shah Shivani
Current Estimated Value
Home Financials for this Owner
Home Financials are based on the most recent Mortgage that was taken out on this home.
Original Mortgage
$370,400
Outstanding Balance
$306,548
Interest Rate
3.75%
Mortgage Type
Adjustable Rate Mortgage/ARM
Estimated Equity
$428,831
Purchase Details
Closed on
Jan 21, 1983
Bought by
Barry Kevin and Barry Linda
Create a Home Valuation Report for This Property
The Home Valuation Report is an in-depth analysis detailing your home's value as well as a comparison with similar homes in the area
Home Values in the Area
Average Home Value in this Area
Purchase History
| Date | Buyer | Sale Price | Title Company |
|---|---|---|---|
| Shah Nirmal P | $463,000 | Chicago Title Co Llc | |
| Barry Kevin | $85,000 | -- |
Source: Public Records
Mortgage History
| Date | Status | Borrower | Loan Amount |
|---|---|---|---|
| Open | Shah Nirmal P | $370,400 |
Source: Public Records
Tax History Compared to Growth
Tax History
| Year | Tax Paid | Tax Assessment Tax Assessment Total Assessment is a certain percentage of the fair market value that is determined by local assessors to be the total taxable value of land and additions on the property. | Land | Improvement |
|---|---|---|---|---|
| 2025 | $14,133 | $115,900 | $31,400 | $84,500 |
| 2024 | $13,711 | $115,900 | $31,400 | $84,500 |
| 2023 | $13,711 | $115,900 | $31,400 | $84,500 |
| 2022 | $13,657 | $115,900 | $31,400 | $84,500 |
| 2021 | $13,267 | $115,900 | $31,400 | $84,500 |
| 2020 | $13,249 | $115,900 | $31,400 | $84,500 |
| 2019 | $13,107 | $115,900 | $31,400 | $84,500 |
| 2018 | $12,885 | $115,900 | $31,400 | $84,500 |
| 2017 | $12,677 | $115,900 | $31,400 | $84,500 |
| 2016 | $12,421 | $115,900 | $31,400 | $84,500 |
| 2015 | $12,129 | $115,900 | $31,400 | $84,500 |
| 2014 | $11,867 | $115,900 | $31,400 | $84,500 |
Source: Public Records
Map
Nearby Homes