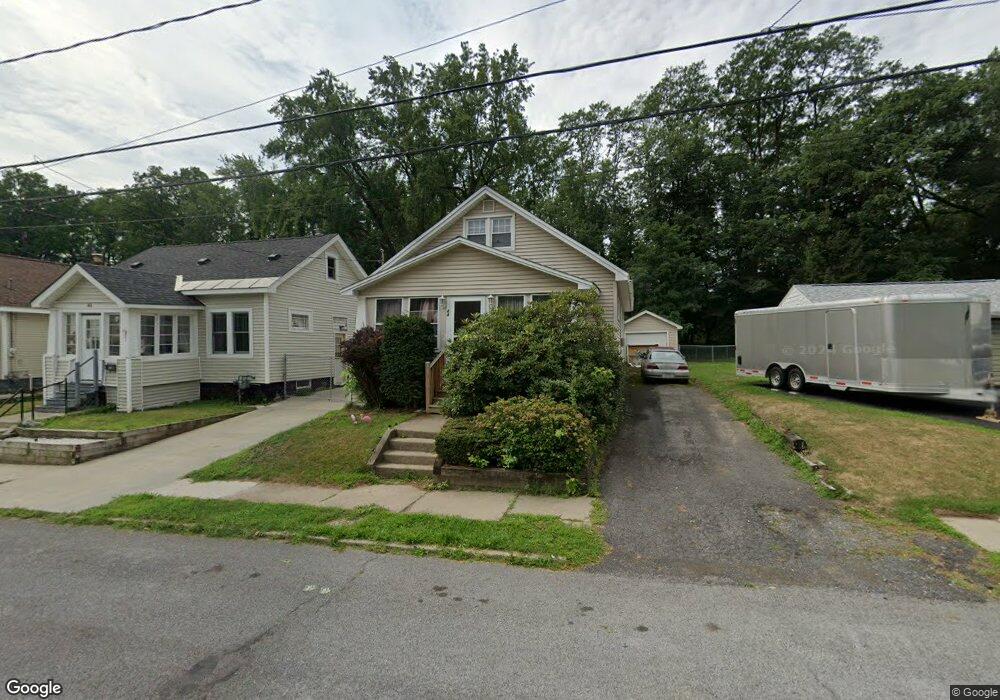
44 Pershing Dr Schenectady, NY 12302
Estimated Value: $211,000 - $260,000
3
Beds
1
Bath
1,122
Sq Ft
$207/Sq Ft
Est. Value
About This Home
This home is located at 44 Pershing Dr, Schenectady, NY 12302 and is currently estimated at $232,284, approximately $207 per square foot. 44 Pershing Dr is a home located in Schenectady County with nearby schools including Scotia Glenville Senior High School and Mekeel Christian Academy.
Ownership History
Date
Name
Owned For
Owner Type
Purchase Details
Closed on
May 23, 2005
Sold by
Pelham James
Bought by
Boomhower Scott A
Current Estimated Value
Home Financials for this Owner
Home Financials are based on the most recent Mortgage that was taken out on this home.
Original Mortgage
$104,176
Outstanding Balance
$53,759
Interest Rate
5.78%
Mortgage Type
FHA
Estimated Equity
$178,525
Purchase Details
Closed on
Jul 28, 1995
Sold by
Kinally Timothy J and Kinally Melissa M
Bought by
Pelham James L and Pelham Shari A
Create a Home Valuation Report for This Property
The Home Valuation Report is an in-depth analysis detailing your home's value as well as a comparison with similar homes in the area
Home Values in the Area
Average Home Value in this Area
Purchase History
| Date | Buyer | Sale Price | Title Company |
|---|---|---|---|
| Boomhower Scott A | $105,000 | Brian Kremer | |
| Pelham James L | $80,600 | -- |
Source: Public Records
Mortgage History
| Date | Status | Borrower | Loan Amount |
|---|---|---|---|
| Open | Boomhower Scott A | $104,176 |
Source: Public Records
Tax History
| Year | Tax Paid | Tax Assessment Tax Assessment Total Assessment is a certain percentage of the fair market value that is determined by local assessors to be the total taxable value of land and additions on the property. | Land | Improvement |
|---|---|---|---|---|
| 2024 | $5,190 | $101,800 | $18,100 | $83,700 |
| 2023 | $45 | $101,800 | $18,100 | $83,700 |
| 2022 | $4,852 | $101,800 | $18,100 | $83,700 |
| 2021 | $5,350 | $101,800 | $18,100 | $83,700 |
| 2020 | $4,169 | $101,800 | $18,100 | $83,700 |
| 2019 | $1,942 | $101,800 | $18,100 | $83,700 |
| 2018 | $4,295 | $101,800 | $18,100 | $83,700 |
| 2017 | $3,787 | $101,800 | $18,100 | $83,700 |
| 2016 | $3,779 | $101,800 | $18,100 | $83,700 |
| 2015 | -- | $101,800 | $18,100 | $83,700 |
| 2014 | -- | $101,800 | $18,100 | $83,700 |
Source: Public Records
Map
Nearby Homes
Your Personal Tour Guide
Ask me questions while you tour the home.