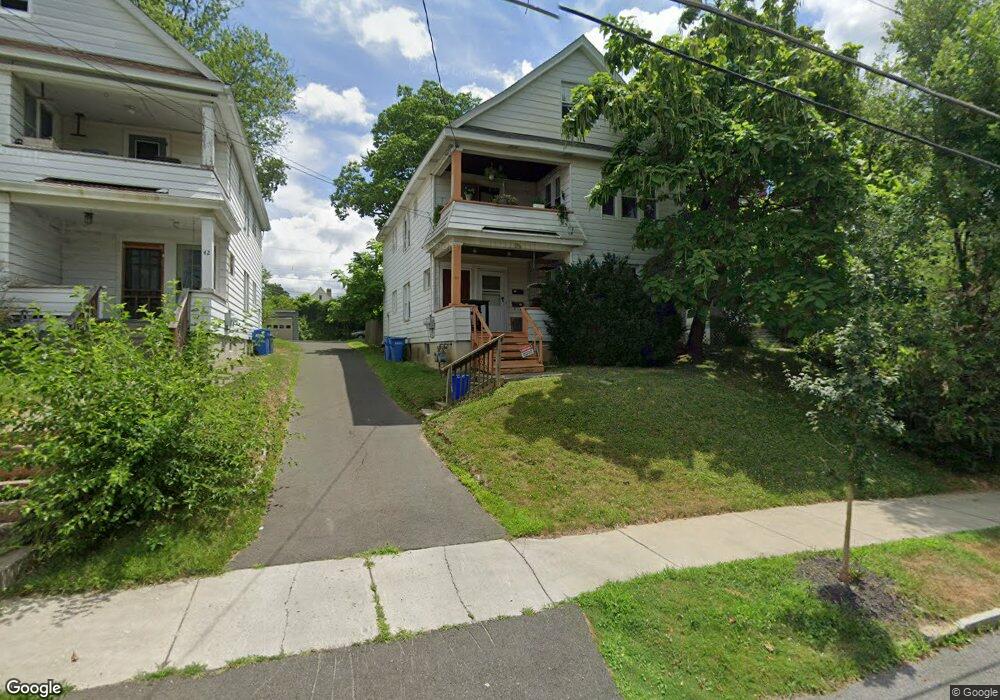
44 Pinewood Ave Albany, NY 12208
Helderberg NeighborhoodEstimated Value: $335,338 - $372,000
4
Beds
2
Baths
2,346
Sq Ft
$151/Sq Ft
Est. Value
About This Home
This home is located at 44 Pinewood Ave, Albany, NY 12208 and is currently estimated at $354,835, approximately $151 per square foot. 44 Pinewood Ave is a home located in Albany County with nearby schools including New Scotland Elementary School, William S Hackett Middle School, and Albany High School.
Ownership History
Date
Name
Owned For
Owner Type
Purchase Details
Closed on
Jul 11, 2008
Sold by
Friedman Aaron
Bought by
Shapiro Marc
Current Estimated Value
Home Financials for this Owner
Home Financials are based on the most recent Mortgage that was taken out on this home.
Original Mortgage
$170,040
Outstanding Balance
$110,253
Interest Rate
6.17%
Estimated Equity
$244,582
Purchase Details
Closed on
Mar 15, 2007
Sold by
Nigriny Matthew
Bought by
Friedman Aaron J
Purchase Details
Closed on
Jul 15, 2004
Sold by
Wylie Wesley
Bought by
Nigriny Matthew
Purchase Details
Closed on
Mar 11, 2002
Sold by
Pogge Karl
Bought by
Wylie Wesly
Purchase Details
Closed on
Jun 13, 2000
Sold by
Doolittle Susan K
Bought by
Pogge Karl F
Purchase Details
Closed on
Nov 19, 1999
Sold by
Keenan Michael J
Bought by
Goodell Allison M
Create a Home Valuation Report for This Property
The Home Valuation Report is an in-depth analysis detailing your home's value as well as a comparison with similar homes in the area
Home Values in the Area
Average Home Value in this Area
Purchase History
| Date | Buyer | Sale Price | Title Company |
|---|---|---|---|
| Shapiro Marc | $212,550 | -- | |
| Shapiro Marc | $213,000 | None Available | |
| Friedman Aaron J | $215,000 | Donald Zee | |
| Nigriny Matthew | $183,000 | David R Juneau | |
| Wylie Wesly | $130,000 | Hicks & Bailly | |
| Pogge Karl F | $18,000 | Dl Doherty | |
| Goodell Allison M | $99,500 | -- |
Source: Public Records
Mortgage History
| Date | Status | Borrower | Loan Amount |
|---|---|---|---|
| Open | Shapiro Marc | $170,040 |
Source: Public Records
Tax History Compared to Growth
Tax History
| Year | Tax Paid | Tax Assessment Tax Assessment Total Assessment is a certain percentage of the fair market value that is determined by local assessors to be the total taxable value of land and additions on the property. | Land | Improvement |
|---|---|---|---|---|
| 2024 | $8,295 | $318,000 | $63,600 | $254,400 |
| 2023 | $8,497 | $211,000 | $42,200 | $168,800 |
| 2022 | $8,312 | $211,000 | $42,200 | $168,800 |
| 2021 | $8,294 | $211,000 | $42,200 | $168,800 |
| 2020 | $8,005 | $211,000 | $42,200 | $168,800 |
| 2019 | $8,307 | $211,000 | $42,200 | $168,800 |
| 2018 | $8,025 | $211,000 | $42,200 | $168,800 |
| 2017 | $4,720 | $211,000 | $42,200 | $168,800 |
| 2016 | $7,783 | $211,000 | $42,200 | $168,800 |
| 2015 | $7,817 | $213,000 | $46,300 | $166,700 |
| 2014 | -- | $213,000 | $46,300 | $166,700 |
Source: Public Records
Map
Nearby Homes
- 38 Harris Ave
- 27 Cardinal Ave
- 2 Glenwood St
- 49 Forest Ave
- 40 Forest Ave
- 59 van Schoick Ave
- 11 Fleetwood Ave
- 121 Ramsey Place
- 133 Ramsey Place
- 39 Lawnridge Ave
- 454 Ontario St
- 17 Lawnridge Ave Unit 17 & 19
- 458 Ontario St
- 4 Edison Ave
- 37 Academy Rd
- 92 Fleetwood Ave
- 155 Woodlawn Ave
- 72 Woodlawn Ave
- 180 S Main Ave
- 107 Fairview Ave
- 42 Pinewood Ave Unit 1
- 42 Pinewood Ave Unit 2
- 42 Pinewood Ave
- 46 Pinewood Ave
- 38 Pinewood Ave
- 50 Pinewood Ave
- 36 Pinewood Ave
- 31 Ramsey Place
- 29 Ramsey Place
- 33 Ramsey Place
- 27 Ramsey Place
- 34 Pinewood Ave
- 25 Ramsey Place
- 37 Ramsey Place
- 54 Pinewood Ave
- 51 Pinewood Ave
- 49 Pinewood Ave
- 53 Pinewood Ave
- 23 Ramsey Place
- 47 Pinewood Ave