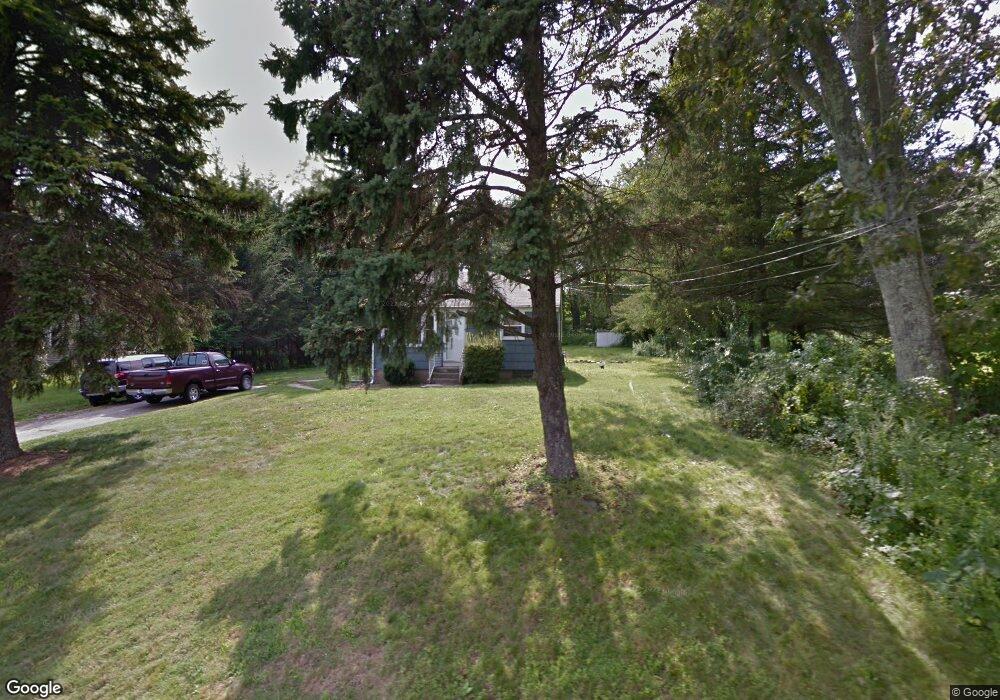
44 Pucker St Coventry, CT 06238
Estimated Value: $211,000 - $249,000
2
Beds
1
Bath
624
Sq Ft
$367/Sq Ft
Est. Value
About This Home
This home is located at 44 Pucker St, Coventry, CT 06238 and is currently estimated at $228,918, approximately $366 per square foot. 44 Pucker St is a home located in Tolland County with nearby schools including George Hersey Robertson School, Coventry Grammar School, and Capt. Nathan Hale School.
Ownership History
Date
Name
Owned For
Owner Type
Purchase Details
Closed on
Jul 29, 2005
Sold by
Desmarais Lisa
Bought by
Elridge Thomas
Current Estimated Value
Purchase Details
Closed on
Dec 11, 2003
Sold by
Delura Daniel and Langdo-Deluca Allison
Bought by
Desmaris Lisa
Purchase Details
Closed on
Aug 28, 2001
Sold by
Langdo Nelson and Langdo Donna
Bought by
Deluca Daniel and Deluca Allison
Purchase Details
Closed on
Jan 30, 1991
Sold by
Henry Joseph and Christensen William
Bought by
Rife Arthur
Create a Home Valuation Report for This Property
The Home Valuation Report is an in-depth analysis detailing your home's value as well as a comparison with similar homes in the area
Home Values in the Area
Average Home Value in this Area
Purchase History
| Date | Buyer | Sale Price | Title Company |
|---|---|---|---|
| Elridge Thomas | $155,000 | -- | |
| Desmaris Lisa | $115,500 | -- | |
| Deluca Daniel | $61,000 | -- | |
| Elridge Thomas | $155,000 | -- | |
| Desmaris Lisa | $115,500 | -- | |
| Deluca Daniel | $61,000 | -- | |
| Rife Arthur | $95,000 | -- |
Source: Public Records
Mortgage History
| Date | Status | Borrower | Loan Amount |
|---|---|---|---|
| Open | Rife Arthur | $147,250 | |
| Closed | Rife Arthur | $35,000 |
Source: Public Records
Tax History
| Year | Tax Paid | Tax Assessment Tax Assessment Total Assessment is a certain percentage of the fair market value that is determined by local assessors to be the total taxable value of land and additions on the property. | Land | Improvement |
|---|---|---|---|---|
| 2025 | $2,882 | $121,300 | $37,400 | $83,900 |
| 2024 | $2,435 | $73,100 | $32,600 | $40,500 |
| 2023 | $2,320 | $73,100 | $32,600 | $40,500 |
| 2022 | $2,277 | $73,100 | $32,600 | $40,500 |
| 2021 | $2,277 | $73,100 | $32,600 | $40,500 |
| 2020 | $2,279 | $73,100 | $32,600 | $40,500 |
| 2019 | $2,347 | $72,900 | $32,600 | $40,300 |
| 2018 | $2,306 | $71,600 | $32,600 | $39,000 |
| 2017 | $2,291 | $71,600 | $32,600 | $39,000 |
| 2016 | $2,234 | $71,600 | $32,600 | $39,000 |
| 2015 | $2,234 | $71,600 | $32,600 | $39,000 |
| 2014 | $2,394 | $84,100 | $40,300 | $43,800 |
Source: Public Records
Map
Nearby Homes
- 550 High St
- 97 Armstrong Rd
- 198 Forest Rd
- 106 S Street Extension
- 103 S Street Extension
- 811 Pucker St
- 0 Woodland Rd
- 127 U S 6
- 17 Route 6
- 457 Stafford Rd
- 23 Thompson Hill Rd
- 17 Ireland Dr
- 498 Root Rd
- 0 Hinkel Mae Dr
- 58 Candide Ln
- 55 Whites Hill Rd
- 27 Fox Trail
- 35 Wyllys Farm Rd
- 152 Cheney Ln
- 31 Wyllys Farm Rd
Your Personal Tour Guide
Ask me questions while you tour the home.