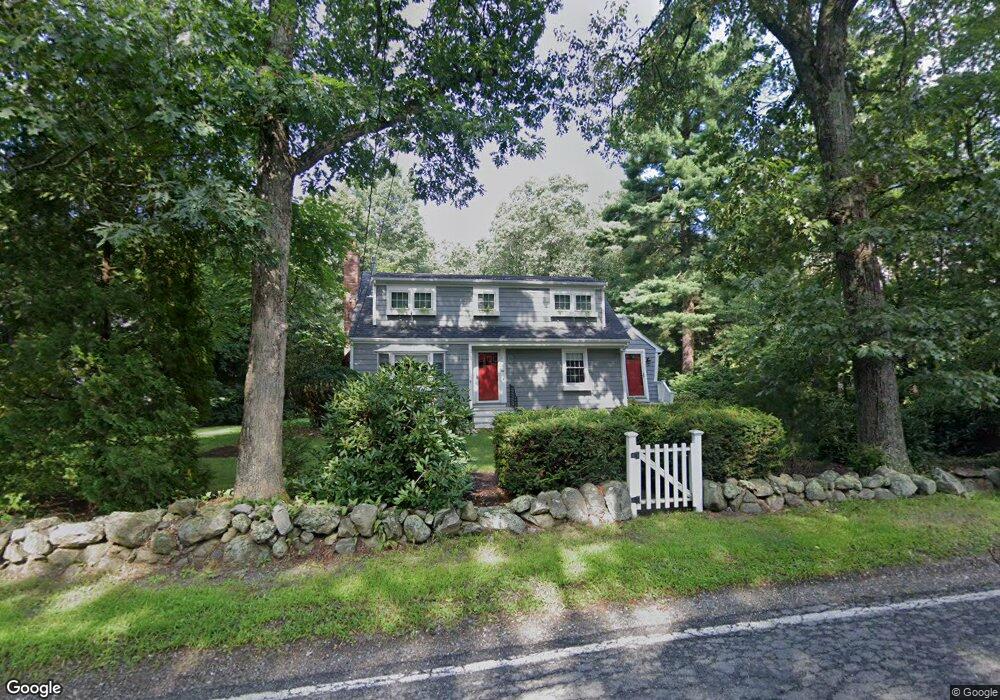
44 Rice Rd Wayland, MA 01778
Estimated Value: $1,128,000 - $1,289,000
4
Beds
3
Baths
2,117
Sq Ft
$558/Sq Ft
Est. Value
About This Home
This home is located at 44 Rice Rd, Wayland, MA 01778 and is currently estimated at $1,181,152, approximately $557 per square foot. 44 Rice Rd is a home located in Middlesex County with nearby schools including Wayland High School, Veritas Christian Academy, and The Rivers School.
Ownership History
Date
Name
Owned For
Owner Type
Purchase Details
Closed on
May 10, 1995
Sold by
Bucksbaum David and Gash Debra
Bought by
Grasso Paul and Grasso Kamala J
Current Estimated Value
Purchase Details
Closed on
Jun 18, 1991
Sold by
Clement Elaine J
Bought by
Bucksbaum David and Gash Debra
Purchase Details
Closed on
Feb 26, 1988
Sold by
Frangos Paul A
Bought by
Clement Elaine J
Create a Home Valuation Report for This Property
The Home Valuation Report is an in-depth analysis detailing your home's value as well as a comparison with similar homes in the area
Home Values in the Area
Average Home Value in this Area
Purchase History
| Date | Buyer | Sale Price | Title Company |
|---|---|---|---|
| Grasso Paul | $264,500 | -- | |
| Bucksbaum David | $215,500 | -- | |
| Clement Elaine J | $267,000 | -- |
Source: Public Records
Mortgage History
| Date | Status | Borrower | Loan Amount |
|---|---|---|---|
| Closed | Clement Elaine J | $150,000 | |
| Closed | Clement Elaine J | $196,000 |
Source: Public Records
Tax History
| Year | Tax Paid | Tax Assessment Tax Assessment Total Assessment is a certain percentage of the fair market value that is determined by local assessors to be the total taxable value of land and additions on the property. | Land | Improvement |
|---|---|---|---|---|
| 2025 | $15,463 | $989,300 | $575,300 | $414,000 |
| 2024 | $14,621 | $942,100 | $547,900 | $394,200 |
| 2023 | $14,196 | $852,600 | $498,000 | $354,600 |
| 2022 | $13,418 | $731,200 | $412,300 | $318,900 |
| 2021 | $3,936 | $693,800 | $374,900 | $318,900 |
| 2020 | $12,322 | $693,800 | $374,900 | $318,900 |
| 2019 | $5,109 | $661,700 | $357,100 | $304,600 |
| 2018 | $11,408 | $632,700 | $357,100 | $275,600 |
| 2017 | $11,093 | $611,500 | $340,100 | $271,400 |
| 2016 | $9,868 | $569,100 | $333,400 | $235,700 |
| 2015 | $10,214 | $555,400 | $333,400 | $222,000 |
Source: Public Records
Map
Nearby Homes
- 58 Rice Rd
- 6 Brewster Rd
- 5 Pickwick Way
- 12 Cutting Cross Way
- 5 Haven Ln
- 16 Coltsway Unit 16CW
- 6 Steepletree Ln
- 205 Hayfield Ln Unit 205
- 6 Briar Ln
- 4 Essex
- 1203 Magnolia Dr Unit 1203
- 186 Main St
- 286 Country Dr
- 1 Cole Rd
- 45 W Plain St Unit 1
- 231 Westerly Rd
- 8 Liberty St
- 79 Walnut Rd
- 22 Lake Shore Dr
- 1 Sunnyside Ave
Your Personal Tour Guide
Ask me questions while you tour the home.