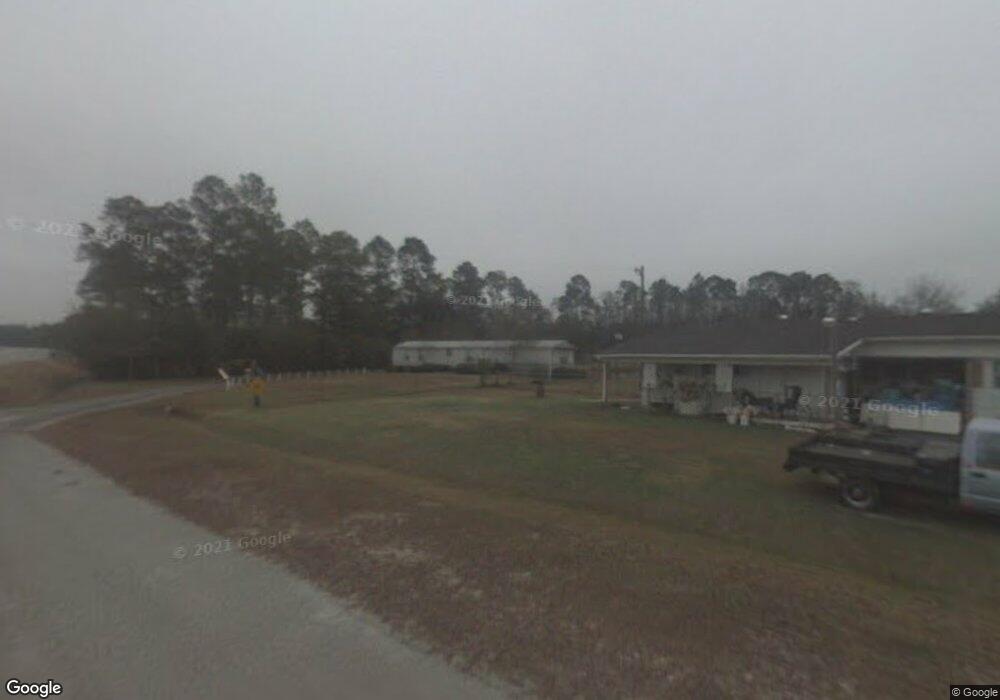
44 Rye Patch Rd Hinesville, GA 31313
Estimated Value: $83,000 - $288,000
2
Beds
1
Bath
960
Sq Ft
$195/Sq Ft
Est. Value
About This Home
This home is located at 44 Rye Patch Rd, Hinesville, GA 31313 and is currently estimated at $186,853, approximately $194 per square foot. 44 Rye Patch Rd is a home with nearby schools including Taylors Creek Elementary School, Lewis Frasier Middle School, and Bradwell Institute.
Ownership History
Date
Name
Owned For
Owner Type
Purchase Details
Closed on
Oct 12, 2023
Sold by
Dickson Jessica
Bought by
Parks Daniel Lee
Current Estimated Value
Home Financials for this Owner
Home Financials are based on the most recent Mortgage that was taken out on this home.
Original Mortgage
$53,300
Outstanding Balance
$29,909
Interest Rate
7.18%
Mortgage Type
New Conventional
Estimated Equity
$156,944
Purchase Details
Closed on
Dec 2, 2009
Sold by
Hurley Isabella W
Bought by
Dickson Jessica
Home Financials for this Owner
Home Financials are based on the most recent Mortgage that was taken out on this home.
Original Mortgage
$50,200
Interest Rate
5.01%
Mortgage Type
Future Advance Clause Open End Mortgage
Purchase Details
Closed on
Mar 26, 1998
Sold by
Hurley Isabella W and Hurley Fred L
Bought by
Hurley Isabella W
Purchase Details
Closed on
Aug 23, 1977
Bought by
Hurley Isabella W and Hurley Fred L
Create a Home Valuation Report for This Property
The Home Valuation Report is an in-depth analysis detailing your home's value as well as a comparison with similar homes in the area
Purchase History
| Date | Buyer | Sale Price | Title Company |
|---|---|---|---|
| Parks Daniel Lee | $52,000 | -- | |
| Dickson Jessica | $50,200 | -- | |
| Hurley Isabella W | -- | -- | |
| Hurley Isabella W | -- | -- |
Source: Public Records
Mortgage History
| Date | Status | Borrower | Loan Amount |
|---|---|---|---|
| Open | Parks Daniel Lee | $53,300 | |
| Previous Owner | Dickson Jessica | $50,200 |
Source: Public Records
Tax History
| Year | Tax Paid | Tax Assessment Tax Assessment Total Assessment is a certain percentage of the fair market value that is determined by local assessors to be the total taxable value of land and additions on the property. | Land | Improvement |
|---|---|---|---|---|
| 2025 | $1,488 | $31,366 | $4,372 | $26,994 |
| 2024 | $1,488 | $20,991 | $4,372 | $16,619 |
| 2023 | $1,039 | $18,325 | $3,500 | $14,825 |
| 2022 | $736 | $14,617 | $2,800 | $11,817 |
| 2021 | $686 | $13,353 | $2,800 | $10,553 |
| 2020 | $685 | $13,541 | $2,800 | $10,741 |
| 2019 | $679 | $13,730 | $2,800 | $10,930 |
| 2018 | $680 | $13,918 | $2,800 | $11,118 |
| 2017 | $465 | $14,107 | $2,800 | $11,307 |
| 2016 | $657 | $14,295 | $2,800 | $11,495 |
| 2015 | $668 | $13,650 | $2,155 | $11,495 |
| 2014 | $668 | $14,457 | $2,285 | $12,172 |
| 2013 | -- | $13,211 | $2,476 | $10,735 |
Source: Public Records
Map
Nearby Homes
- 1.17 ACRES Elam Rd
- 1033 Barley Dr
- 124 Willow Ln NE
- 31 Idus Ln
- 831 Ann Dr
- 2563 Zachary Ct
- 62 Clydesdale Ct NE
- 757 Melissa Dr
- 608 Mustang Ln NE
- 50 Clydesdale Ct NE
- 0 Airport Rd Unit 325633
- 178 Lee Place Rd NE
- 331 Lee Place Rd NE
- 305 Worthington Dr
- 50 Palamino Trail NE
- 89 Virginia Rd
- 85 Brightleaf Cir
- 54 Cumberland Dr NE
- 43 Yearling Ct
- 519 Forsyth Dr
- 122 Pulaski St
- 108 Pulaski St
- 26 Rye Patch Rd
- 154 Pulaski St
- 80 Pulaski St
- 3560 Ga Highway 196 W
- 0 Pulaski Dr Unit LOT 96 02827423
- 0 Pulaski Dr Unit LOT 93 02802312
- 0 Pulaski Dr Unit LOT 97 02758109
- 109 Pulaski St
- 52 Pulaski St
- 127 Pulaski St
- 160 Pulaski St Unit 96
- 160 Pulaski St
- 118 Rye Patch Rd
- 73 Pulaski St Unit n/a
- 73 Pulaski St
- 73 Pulaski St
- 155 Pulaski St
- 49 Pulaski St
Your Personal Tour Guide
Ask me questions while you tour the home.