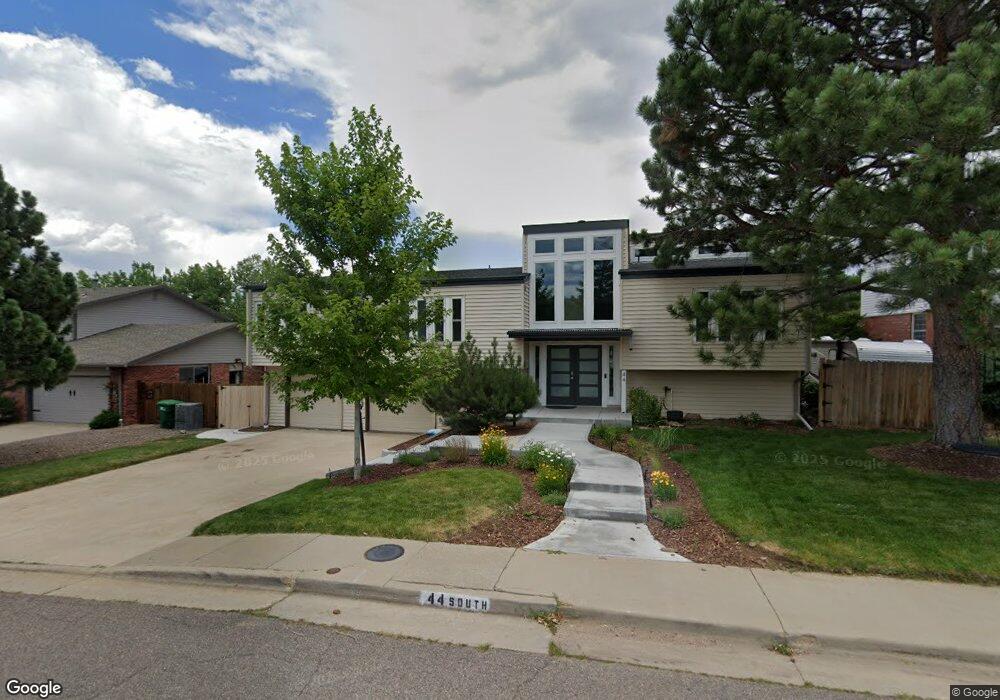
44 S Flora Way Golden, CO 80401
Sixth Avenue West NeighborhoodEstimated Value: $854,000 - $1,055,000
4
Beds
3
Baths
2,932
Sq Ft
$324/Sq Ft
Est. Value
About This Home
This home is located at 44 S Flora Way, Golden, CO 80401 and is currently estimated at $950,151, approximately $324 per square foot. 44 S Flora Way is a home located in Jefferson County with nearby schools including Kyffin Elementary School, Bell Middle School, and Golden High School.
Ownership History
Date
Name
Owned For
Owner Type
Purchase Details
Closed on
Oct 1, 2024
Sold by
Zanca Chad and Manikowski Leea
Bought by
Zanca Manikowski Family Trust
Current Estimated Value
Purchase Details
Closed on
Aug 30, 2019
Sold by
Sph Property One Llc
Bought by
Zanca Chad and Manikowski Leea
Home Financials for this Owner
Home Financials are based on the most recent Mortgage that was taken out on this home.
Original Mortgage
$446,400
Interest Rate
3.8%
Mortgage Type
New Conventional
Purchase Details
Closed on
Jun 26, 2019
Sold by
Gillian Arland Anthony and Gillian Arland
Bought by
Sph Property One Llc
Purchase Details
Closed on
Jan 27, 2011
Sold by
Moeller Donald F and Moeller Darlene A
Bought by
Arland Anthony and Arland Gillian
Home Financials for this Owner
Home Financials are based on the most recent Mortgage that was taken out on this home.
Original Mortgage
$343,563
Interest Rate
4.5%
Mortgage Type
FHA
Create a Home Valuation Report for This Property
The Home Valuation Report is an in-depth analysis detailing your home's value as well as a comparison with similar homes in the area
Home Values in the Area
Average Home Value in this Area
Purchase History
| Date | Buyer | Sale Price | Title Company |
|---|---|---|---|
| Zanca Manikowski Family Trust | -- | None Listed On Document | |
| Zanca Chad | $558,000 | None Available | |
| Sph Property One Llc | $555,000 | None Available | |
| Arland Anthony | $352,500 | None Available |
Source: Public Records
Mortgage History
| Date | Status | Borrower | Loan Amount |
|---|---|---|---|
| Previous Owner | Zanca Chad | $446,400 | |
| Previous Owner | Arland Anthony | $343,563 |
Source: Public Records
Tax History Compared to Growth
Tax History
| Year | Tax Paid | Tax Assessment Tax Assessment Total Assessment is a certain percentage of the fair market value that is determined by local assessors to be the total taxable value of land and additions on the property. | Land | Improvement |
|---|---|---|---|---|
| 2024 | $5,023 | $49,216 | $19,282 | $29,934 |
| 2023 | $5,023 | $49,216 | $19,282 | $29,934 |
| 2022 | $3,979 | $38,291 | $15,563 | $22,728 |
| 2021 | $4,031 | $39,393 | $16,011 | $23,382 |
| 2020 | $3,871 | $37,907 | $12,050 | $25,857 |
| 2019 | $3,823 | $37,907 | $12,050 | $25,857 |
| 2018 | $3,631 | $34,866 | $10,560 | $24,306 |
| 2017 | $3,326 | $34,866 | $10,560 | $24,306 |
| 2016 | $3,973 | $40,357 | $10,483 | $29,874 |
| 2015 | $3,041 | $40,357 | $10,483 | $29,874 |
| 2014 | $3,041 | $29,126 | $8,955 | $20,171 |
Source: Public Records
Map
Nearby Homes
- 118 S Eldridge Way
- 108 S Holman Way Unit 108
- 98 S Holman Way Unit 98
- 14354 W 3rd Ave
- 14721 W Ellsworth Ave Unit 14721
- 14533 W 3rd Ave
- 382 Gladiola St Unit E382
- 14317 W 4th Place
- 13792 W Dakota Ave
- 15207 W Ellsworth Place
- 446 S Fig Way
- 496 Eldridge Ct
- 14072 W Alaska Dr
- 13561 W Alaska Place
- 13093 W Cedar Dr Unit 121
- 13093 W Cedar Dr Unit 322
- 13095 W Cedar Dr Unit 302
- 13925 W 6th Place
- 244 Zang St
- 400 Zang St Unit 1-202
- 54 S Flora Way
- 34 S Flora Way
- 64 S Flora Way
- 24 S Flora Way
- 14351 W Archer Ave
- 14352 W Archer Ave
- 74 S Flora Way
- 14 S Flora Way
- 14367 W Bayaud Ave
- 14360 W Ellsworth Ave
- 14361 W Archer Ave
- 14362 W Archer Ave
- 84 S Flora Way
- 14370 W Ellsworth Ave
- 24 Flora Way
- 14377 W Bayaud Ave
- 14358 W Bayaud Ave
- 14371 W Archer Ave
- 14372 W Archer Ave
- 34 Flora Way