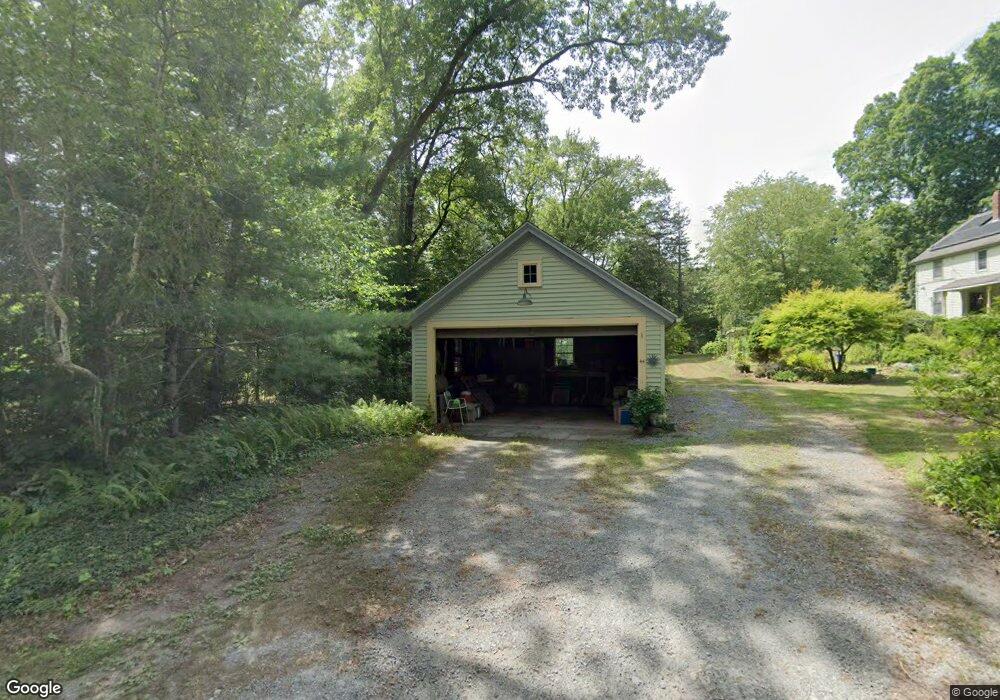
44 School St Rehoboth, MA 02769
Estimated Value: $473,000 - $741,000
3
Beds
1
Bath
1,070
Sq Ft
$546/Sq Ft
Est. Value
About This Home
This home is located at 44 School St, Rehoboth, MA 02769 and is currently estimated at $584,534, approximately $546 per square foot. 44 School St is a home located in Bristol County with nearby schools including Dighton-Rehoboth Regional High School and Cedar Brook School.
Ownership History
Date
Name
Owned For
Owner Type
Purchase Details
Closed on
Nov 18, 1996
Sold by
Morpeth Charlotte N and Morpeth Clarence R
Bought by
Reinbold James S and Reinbold Sandra A
Current Estimated Value
Home Financials for this Owner
Home Financials are based on the most recent Mortgage that was taken out on this home.
Original Mortgage
$127,000
Outstanding Balance
$12,406
Interest Rate
7.99%
Mortgage Type
Purchase Money Mortgage
Estimated Equity
$572,128
Create a Home Valuation Report for This Property
The Home Valuation Report is an in-depth analysis detailing your home's value as well as a comparison with similar homes in the area
Home Values in the Area
Average Home Value in this Area
Purchase History
| Date | Buyer | Sale Price | Title Company |
|---|---|---|---|
| Reinbold James S | $175,000 | -- |
Source: Public Records
Mortgage History
| Date | Status | Borrower | Loan Amount |
|---|---|---|---|
| Open | Reinbold James S | $25,000 | |
| Open | Reinbold James S | $127,000 |
Source: Public Records
Tax History Compared to Growth
Tax History
| Year | Tax Paid | Tax Assessment Tax Assessment Total Assessment is a certain percentage of the fair market value that is determined by local assessors to be the total taxable value of land and additions on the property. | Land | Improvement |
|---|---|---|---|---|
| 2025 | $45 | $406,700 | $228,300 | $178,400 |
| 2024 | $4,414 | $388,600 | $228,300 | $160,300 |
| 2023 | $4,369 | $377,300 | $224,300 | $153,000 |
| 2022 | $4,097 | $323,400 | $215,900 | $107,500 |
| 2021 | $6,662 | $304,000 | $199,600 | $104,400 |
| 2020 | $3,342 | $294,700 | $199,600 | $95,100 |
| 2018 | $3,422 | $285,900 | $191,800 | $94,100 |
| 2017 | $5,317 | $285,900 | $191,800 | $94,100 |
| 2016 | $3,474 | $285,900 | $191,800 | $94,100 |
| 2015 | $3,299 | $268,000 | $184,600 | $83,400 |
| 2014 | $3,182 | $255,800 | $177,400 | $78,400 |
Source: Public Records
Map
Nearby Homes