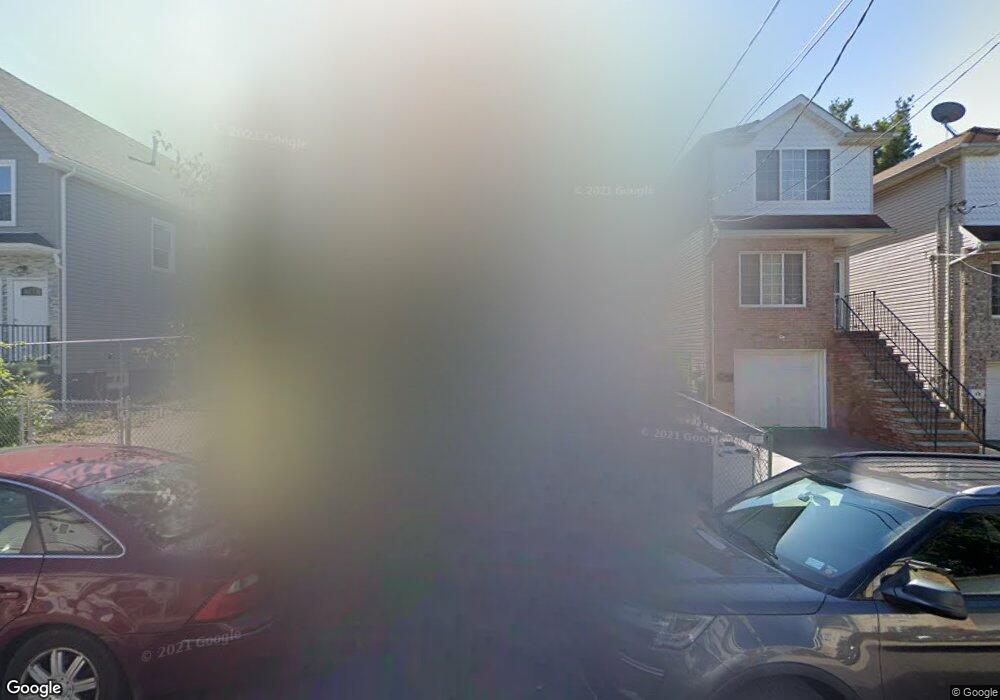
44 South St Staten Island, NY 10310
West Brighton NeighborhoodEstimated Value: $454,754 - $777,000
--
Bed
--
Bath
1,012
Sq Ft
$577/Sq Ft
Est. Value
About This Home
This home is located at 44 South St, Staten Island, NY 10310 and is currently estimated at $583,939, approximately $577 per square foot. 44 South St is a home located in Richmond County with nearby schools including P.S. 45 John Tyler, Intermediate School 27, and Susan E Wagner High School.
Ownership History
Date
Name
Owned For
Owner Type
Purchase Details
Closed on
Apr 24, 2020
Sold by
Grinberg Management & Development Llc
Bought by
Cary Avenue Ventures Llc
Current Estimated Value
Purchase Details
Closed on
Nov 12, 2019
Sold by
Weiss Sheldon R and Weiss Teresa F
Bought by
Grin Berg Management & Development Llc
Purchase Details
Closed on
Jan 12, 2017
Sold by
Barth John D and Barth Annie
Bought by
Grinberg Management & Development Llc
Home Financials for this Owner
Home Financials are based on the most recent Mortgage that was taken out on this home.
Original Mortgage
$356,000
Interest Rate
4.15%
Mortgage Type
Purchase Money Mortgage
Create a Home Valuation Report for This Property
The Home Valuation Report is an in-depth analysis detailing your home's value as well as a comparison with similar homes in the area
Home Values in the Area
Average Home Value in this Area
Purchase History
| Date | Buyer | Sale Price | Title Company |
|---|---|---|---|
| Cary Avenue Ventures Llc | -- | None Available | |
| Grin Berg Management & Development Llc | -- | Forest Abstract Llc | |
| Grinberg Management & Development Llc | $160,500 | None Available |
Source: Public Records
Mortgage History
| Date | Status | Borrower | Loan Amount |
|---|---|---|---|
| Previous Owner | Grinberg Management & Development Llc | $356,000 |
Source: Public Records
Tax History Compared to Growth
Tax History
| Year | Tax Paid | Tax Assessment Tax Assessment Total Assessment is a certain percentage of the fair market value that is determined by local assessors to be the total taxable value of land and additions on the property. | Land | Improvement |
|---|---|---|---|---|
| 2025 | $3,983 | $28,860 | $6,348 | $22,512 |
| 2024 | $3,983 | $26,940 | $6,537 | $20,403 |
| 2023 | $3,685 | $18,144 | $6,117 | $12,027 |
| 2022 | $3,497 | $26,580 | $8,880 | $17,700 |
| 2021 | $3,513 | $22,020 | $8,880 | $13,140 |
| 2020 | $6,100 | $19,020 | $8,880 | $10,140 |
| 2019 | $9,578 | $18,480 | $8,880 | $9,600 |
| 2018 | $3,082 | $15,120 | $8,880 | $6,240 |
| 2017 | $1,262 | $12,147 | $8,856 | $3,291 |
| 2016 | $2,291 | $11,460 | $8,880 | $2,580 |
| 2015 | $3,024 | $16,080 | $8,880 | $7,200 |
| 2014 | $3,024 | $15,758 | $7,404 | $8,354 |
Source: Public Records
Map
Nearby Homes
- 56 South St
- 361 Broadway
- 305 Broadway
- 386 N Burgher Ave
- 1001 Castleton Ave
- 1064 Castleton Ave
- 943 Castleton Ave
- 555 Delafield Ave
- 46 Winegar Ln
- 207 N Burgher Ave
- 335 Oakland Ave
- 331 Oakland Ave
- 698 Henderson Ave
- 718 Henderson Ave
- 46 Elizabeth St
- 432 Pelton Ave
- 699 Henderson Ave
- 582 Cary Ave
- 123 Roe St
- 657 Delafield Ave
- 48 South St
- 40 South St
- 50 South St
- 38 South St
- 52 South St
- 510 E 80 Th St Unit 14-C
- 510 E 80 Th St Unit 4 E
- 510 E 80 Th St Unit 2 G
- 510 E 80 Th St Unit 1 A
- 510 E 80 Th St Unit 7 C
- 510 E 80 Th St Unit 12 D
- 510 E 80 Th St Unit 12 E
- 510 E 80 Th St Unit 4 C
- 510 E 80 Th St Unit 14-D
- 510 E 80 Th St Unit 5 A
- 510 E 80 Th St Unit 4-F
- 510 E 80 Th St Unit 15-D
- 510 E 80 Th St Unit 3 G
- 510 E 80 Th St Unit 11-G
- 510 E 80 Th St Unit 14-B
