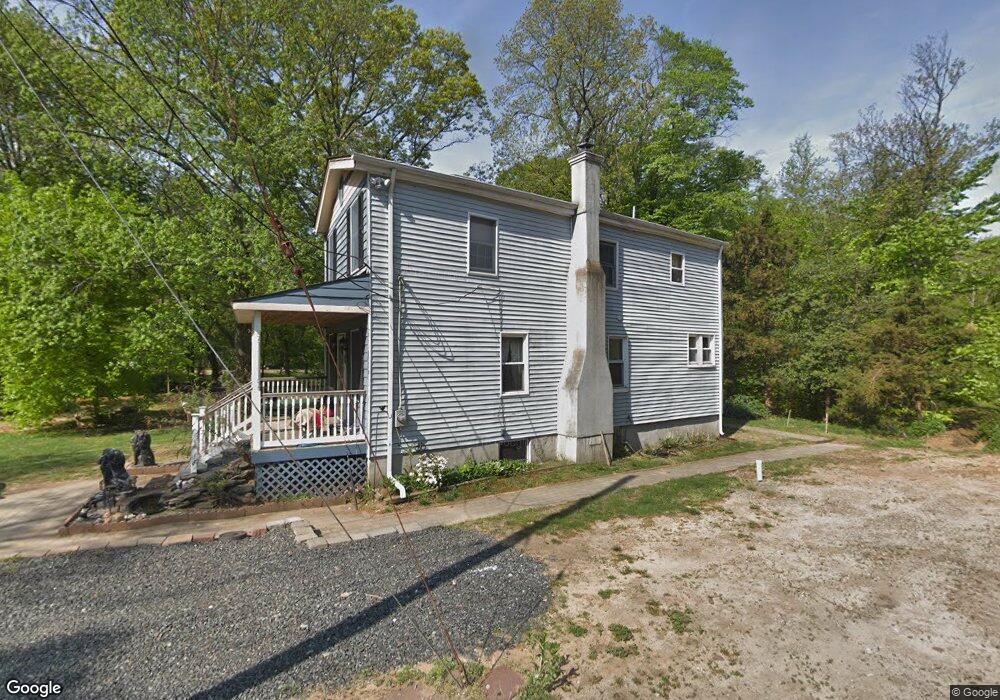
44 Taft Place Matawan, NJ 07747
Estimated Value: $553,000 - $637,000
3
Beds
2
Baths
1,764
Sq Ft
$335/Sq Ft
Est. Value
About This Home
This home is located at 44 Taft Place, Matawan, NJ 07747 and is currently estimated at $590,792, approximately $334 per square foot. 44 Taft Place is a home located in Monmouth County with nearby schools including Matawan Reg High School, Matawan Montessori Academy, and St. Joseph Elementary School.
Ownership History
Date
Name
Owned For
Owner Type
Purchase Details
Closed on
Dec 21, 2012
Sold by
Boyton Steven
Bought by
Boyton Steven
Current Estimated Value
Home Financials for this Owner
Home Financials are based on the most recent Mortgage that was taken out on this home.
Original Mortgage
$138,700
Outstanding Balance
$97,474
Interest Rate
3.35%
Mortgage Type
New Conventional
Estimated Equity
$493,318
Purchase Details
Closed on
Jan 27, 2009
Sold by
Boyton Debbie
Bought by
Boyton Steven
Home Financials for this Owner
Home Financials are based on the most recent Mortgage that was taken out on this home.
Original Mortgage
$127,000
Interest Rate
5.06%
Mortgage Type
New Conventional
Create a Home Valuation Report for This Property
The Home Valuation Report is an in-depth analysis detailing your home's value as well as a comparison with similar homes in the area
Home Values in the Area
Average Home Value in this Area
Purchase History
| Date | Buyer | Sale Price | Title Company |
|---|---|---|---|
| Boyton Steven | -- | None Available | |
| Boyton Steven | -- | Stewart Title Guaranty Co |
Source: Public Records
Mortgage History
| Date | Status | Borrower | Loan Amount |
|---|---|---|---|
| Open | Boyton Steven | $138,700 | |
| Previous Owner | Boyton Steven | $127,000 |
Source: Public Records
Tax History Compared to Growth
Tax History
| Year | Tax Paid | Tax Assessment Tax Assessment Total Assessment is a certain percentage of the fair market value that is determined by local assessors to be the total taxable value of land and additions on the property. | Land | Improvement |
|---|---|---|---|---|
| 2025 | $8,492 | $474,000 | $294,900 | $179,100 |
| 2024 | $8,586 | $420,200 | $244,400 | $175,800 |
| 2023 | $8,586 | $401,400 | $229,700 | $171,700 |
| 2022 | $8,843 | $392,800 | $229,300 | $163,500 |
| 2021 | $8,843 | $351,100 | $205,700 | $145,400 |
| 2020 | $8,707 | $320,800 | $178,700 | $142,100 |
| 2019 | $8,941 | $320,000 | $178,700 | $141,300 |
| 2018 | $8,397 | $301,300 | $166,600 | $134,700 |
| 2017 | $7,530 | $274,000 | $137,600 | $136,400 |
| 2016 | $6,727 | $255,500 | $122,600 | $132,900 |
| 2015 | $6,970 | $254,100 | $124,600 | $129,500 |
| 2014 | $6,946 | $258,200 | $129,600 | $128,600 |
Source: Public Records
Map
Nearby Homes