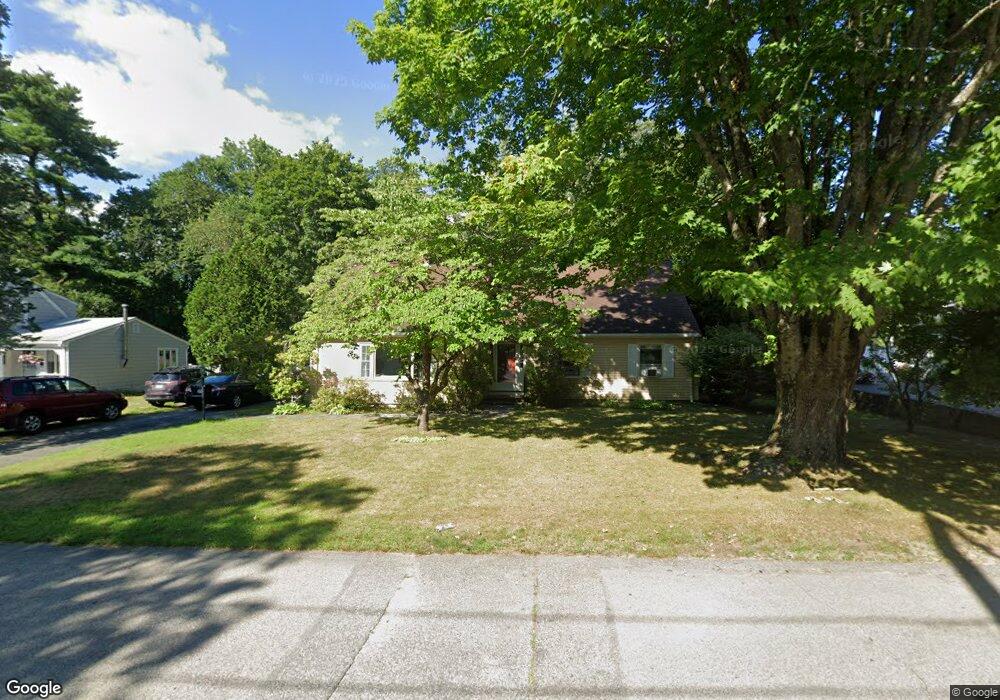
44 Tyler St Attleboro, MA 02703
Estimated Value: $596,483 - $696,000
3
Beds
2
Baths
2,177
Sq Ft
$292/Sq Ft
Est. Value
About This Home
This home is located at 44 Tyler St, Attleboro, MA 02703 and is currently estimated at $636,621, approximately $292 per square foot. 44 Tyler St is a home located in Bristol County with nearby schools including Peter Thacher Elementary School, Wamsutta Middle School, and Attleboro High School.
Ownership History
Date
Name
Owned For
Owner Type
Purchase Details
Closed on
Jul 30, 2004
Sold by
Thayer Linda P and Thayer Robert A
Bought by
Legg Jeffrey J and Legg Kathleen S
Current Estimated Value
Home Financials for this Owner
Home Financials are based on the most recent Mortgage that was taken out on this home.
Original Mortgage
$138,000
Outstanding Balance
$69,926
Interest Rate
6.33%
Mortgage Type
Purchase Money Mortgage
Estimated Equity
$566,695
Create a Home Valuation Report for This Property
The Home Valuation Report is an in-depth analysis detailing your home's value as well as a comparison with similar homes in the area
Home Values in the Area
Average Home Value in this Area
Purchase History
| Date | Buyer | Sale Price | Title Company |
|---|---|---|---|
| Legg Jeffrey J | $354,900 | -- |
Source: Public Records
Mortgage History
| Date | Status | Borrower | Loan Amount |
|---|---|---|---|
| Open | Legg Jeffrey J | $138,000 |
Source: Public Records
Tax History
| Year | Tax Paid | Tax Assessment Tax Assessment Total Assessment is a certain percentage of the fair market value that is determined by local assessors to be the total taxable value of land and additions on the property. | Land | Improvement |
|---|---|---|---|---|
| 2025 | $6,310 | $502,800 | $136,900 | $365,900 |
| 2024 | $6,079 | $477,500 | $136,900 | $340,600 |
| 2023 | $5,673 | $414,400 | $124,400 | $290,000 |
| 2022 | $5,338 | $369,400 | $118,400 | $251,000 |
| 2021 | $5,136 | $347,000 | $114,000 | $233,000 |
| 2020 | $4,902 | $336,700 | $110,700 | $226,000 |
| 2019 | $4,610 | $325,600 | $108,500 | $217,100 |
| 2018 | $4,366 | $294,600 | $105,400 | $189,200 |
| 2017 | $4,220 | $290,000 | $105,400 | $184,600 |
| 2016 | $4,095 | $276,300 | $103,400 | $172,900 |
| 2015 | $3,858 | $262,300 | $103,400 | $158,900 |
| 2014 | $3,770 | $253,900 | $98,500 | $155,400 |
Source: Public Records
Map
Nearby Homes
- 72 Grant St
- 6 Dailey St Unit J
- 7 Dailey St Unit I
- 138 Fisher St Unit A
- 1 Bellmore St
- 142 Fisher St Unit B
- 142 Fisher St Unit A
- 126 Linden St Unit A
- 0 Joseph St Unit 73469304
- 0 Tulip Unit 73482326
- 0 Tulip Unit 73482330
- 19 Amber Ln
- 95 Mulberry St
- 96 Mary Rocha Way
- 855 County St Unit 2
- 17 Jewel Ave
- 78 Saveena Dr
- 74 Saveena Dr
- 91 East St
- 124 Tiffany St
Your Personal Tour Guide
Ask me questions while you tour the home.