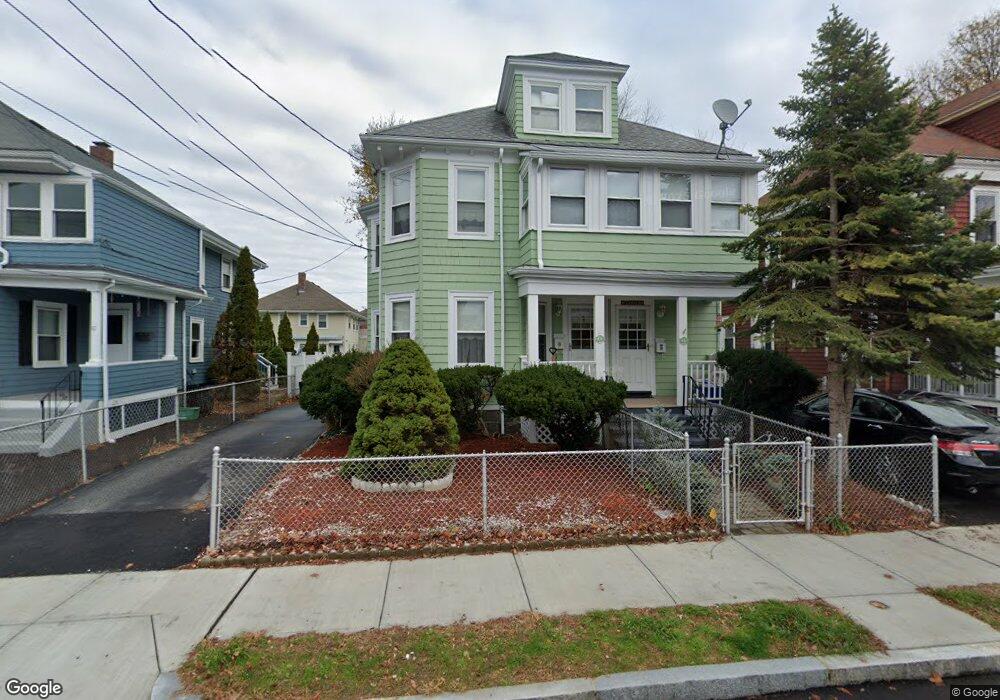
44 Tyler St Quincy, MA 02171
North Quincy NeighborhoodEstimated Value: $835,884 - $1,238,000
5
Beds
2
Baths
2,678
Sq Ft
$407/Sq Ft
Est. Value
About This Home
This home is located at 44 Tyler St, Quincy, MA 02171 and is currently estimated at $1,089,221, approximately $406 per square foot. 44 Tyler St is a home located in Norfolk County with nearby schools including Francis W. Parker Elementary School, Atlantic Middle School, and North Quincy High School.
Ownership History
Date
Name
Owned For
Owner Type
Purchase Details
Closed on
Apr 12, 2021
Sold by
Maryann Cannata Irt
Bought by
Lin Bingbing and Zou Shou D
Current Estimated Value
Home Financials for this Owner
Home Financials are based on the most recent Mortgage that was taken out on this home.
Original Mortgage
$563,500
Outstanding Balance
$507,951
Interest Rate
2.9%
Mortgage Type
Purchase Money Mortgage
Estimated Equity
$581,270
Purchase Details
Closed on
Jul 26, 2018
Sold by
Cannata Maryann
Bought by
Maryann Cannata Irt
Create a Home Valuation Report for This Property
The Home Valuation Report is an in-depth analysis detailing your home's value as well as a comparison with similar homes in the area
Home Values in the Area
Average Home Value in this Area
Purchase History
| Date | Buyer | Sale Price | Title Company |
|---|---|---|---|
| Lin Bingbing | $805,000 | None Available | |
| Maryann Cannata Irt | -- | -- |
Source: Public Records
Mortgage History
| Date | Status | Borrower | Loan Amount |
|---|---|---|---|
| Open | Lin Bingbing | $563,500 |
Source: Public Records
Tax History Compared to Growth
Tax History
| Year | Tax Paid | Tax Assessment Tax Assessment Total Assessment is a certain percentage of the fair market value that is determined by local assessors to be the total taxable value of land and additions on the property. | Land | Improvement |
|---|---|---|---|---|
| 2025 | $10,452 | $906,500 | $366,000 | $540,500 |
| 2024 | $10,031 | $890,100 | $366,000 | $524,100 |
| 2023 | $9,371 | $842,000 | $332,800 | $509,200 |
| 2022 | $9,001 | $751,300 | $266,200 | $485,100 |
| 2021 | $9,164 | $754,900 | $266,200 | $488,700 |
| 2020 | $8,920 | $717,600 | $261,000 | $456,600 |
| 2019 | $8,539 | $680,400 | $251,000 | $429,400 |
| 2018 | $8,107 | $607,700 | $239,000 | $368,700 |
| 2017 | $8,020 | $566,000 | $217,300 | $348,700 |
| 2016 | $6,847 | $476,800 | $197,500 | $279,300 |
| 2015 | $6,485 | $444,200 | $179,600 | $264,600 |
| 2014 | $5,776 | $388,700 | $179,600 | $209,100 |
Source: Public Records
Map
Nearby Homes
- 17 Holmes St Unit 2
- 17 Holmes St Unit 3
- 10 Weston Ave Unit 322
- 85 E Squantum St Unit 10
- 39 Fayette St Unit 403
- 98 Safford St
- 58 Bayfield Rd S
- 201 Billings St
- 52 Hamilton Ave
- 297 Billings St
- 154 N Central Ave
- 55 Copley St
- 197 Hobart St
- 22 Conant Rd
- 23 Myrtle St
- 253 W Squantum St
- 22 Newton Ave
- 175 Quincy Shore Dr Unit B24
- 165 Quincy Shore Dr Unit C63
- 13 Ash St
- 50 Tyler St
- 40 Tyler St
- 40-42 Tyler St
- 42 Tyler St Unit 1
- 42 Tyler St
- 43 Freeman St
- 38 Tyler St
- 52 Tyler St Unit 54
- 39 Freeman St
- 47 Freeman St
- 49 Freeman St Unit 2
- 47 Freeman St Unit 2
- 47 Freeman St Unit 3
- 49 Freeman St
- 47 Freeman St Unit 1
- 49 Freeman St Unit 3
- 49 Freeman St Unit 49
- 41 Tyler St
- 49 Tyler St
- 53 Freeman St