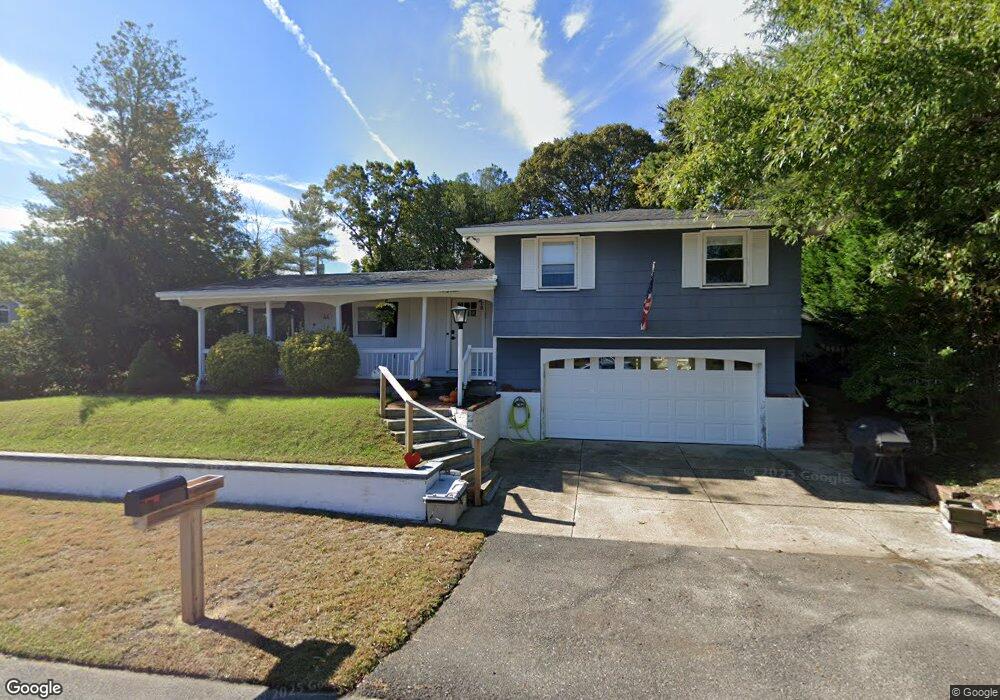
44 Ventnor Ave Marmora, NJ 08223
Estimated Value: $371,579 - $470,000
--
Bed
--
Bath
1,232
Sq Ft
$342/Sq Ft
Est. Value
About This Home
This home is located at 44 Ventnor Ave, Marmora, NJ 08223 and is currently estimated at $421,895, approximately $342 per square foot. 44 Ventnor Ave is a home located in Cape May County with nearby schools including Upper Township Primary School, Upper Township Elementary School, and Upper Township Middle School.
Ownership History
Date
Name
Owned For
Owner Type
Purchase Details
Closed on
Oct 15, 2021
Sold by
Sommer Nancy G Est
Bought by
Harper Clayton and Harper Erica
Current Estimated Value
Home Financials for this Owner
Home Financials are based on the most recent Mortgage that was taken out on this home.
Original Mortgage
$265,780
Outstanding Balance
$242,367
Interest Rate
2.8%
Mortgage Type
Purchase Money Mortgage
Estimated Equity
$179,528
Purchase Details
Closed on
Sep 30, 1992
Sold by
Tatham Edith M
Bought by
Sommer Sommer W and Sommer Nancy G
Create a Home Valuation Report for This Property
The Home Valuation Report is an in-depth analysis detailing your home's value as well as a comparison with similar homes in the area
Home Values in the Area
Average Home Value in this Area
Purchase History
| Date | Buyer | Sale Price | Title Company |
|---|---|---|---|
| Harper Clayton | $274,000 | None Available | |
| Sommer Sommer W | $125,000 | -- | |
| Sommer Sommer W | $125,000 | -- |
Source: Public Records
Mortgage History
| Date | Status | Borrower | Loan Amount |
|---|---|---|---|
| Open | Harper Clayton | $265,780 |
Source: Public Records
Tax History Compared to Growth
Tax History
| Year | Tax Paid | Tax Assessment Tax Assessment Total Assessment is a certain percentage of the fair market value that is determined by local assessors to be the total taxable value of land and additions on the property. | Land | Improvement |
|---|---|---|---|---|
| 2025 | $5,416 | $236,000 | $114,600 | $121,400 |
| 2024 | $5,416 | $236,000 | $114,600 | $121,400 |
| 2023 | $5,150 | $236,000 | $114,600 | $121,400 |
| 2022 | $4,961 | $236,000 | $114,600 | $121,400 |
| 2021 | $4,781 | $236,000 | $114,600 | $121,400 |
| 2020 | $4,600 | $236,000 | $114,600 | $121,400 |
| 2019 | $4,477 | $236,000 | $114,600 | $121,400 |
| 2018 | $4,267 | $231,000 | $114,600 | $116,400 |
| 2017 | $4,213 | $231,000 | $114,600 | $116,400 |
| 2016 | $3,688 | $198,800 | $114,600 | $84,200 |
| 2015 | $3,588 | $198,800 | $114,600 | $84,200 |
| 2014 | $3,876 | $263,300 | $167,200 | $96,100 |
Source: Public Records
Map
Nearby Homes
- 16 Lenape Ln
- 202 N Shore Rd
- 125 N Shore Rd
- 601 2nd Ave
- 32 Norwood Rd
- 527 N 527 N Shore Rd
- 14 Lyndhurst Rd
- 1 Roosevelt Blvd
- 14 Roberts Ave
- 246 Egret Ln
- 15 Waterway Rd
- 13 Waterway Rd
- 100 Reef Dr
- 214 Bartram Ln
- 430 S Shore Rd
- 3103 Bayland Dr
- 3709 Waterview Blvd
- 3708 Westminster Ln
- 3108 Bay Ave
- 3604 Oxford Ln