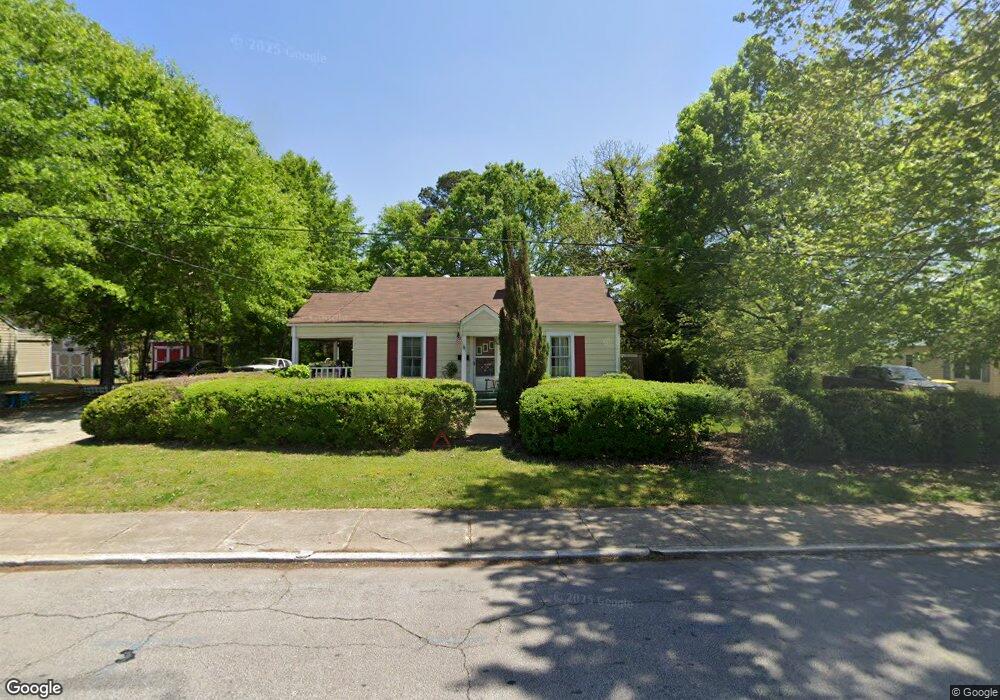
44 Wade St Winder, GA 30680
Estimated Value: $196,826 - $257,000
2
Beds
1
Bath
984
Sq Ft
$222/Sq Ft
Est. Value
About This Home
This home is located at 44 Wade St, Winder, GA 30680 and is currently estimated at $218,457, approximately $222 per square foot. 44 Wade St is a home located in Barrow County with nearby schools including Kennedy Elementary School, Westside Middle School, and Apalachee High School.
Ownership History
Date
Name
Owned For
Owner Type
Purchase Details
Closed on
Aug 3, 2001
Sold by
Rogers Jeffrey P and Rogers Jennifer L
Bought by
Morrow Lee
Current Estimated Value
Home Financials for this Owner
Home Financials are based on the most recent Mortgage that was taken out on this home.
Original Mortgage
$84,333
Outstanding Balance
$32,778
Interest Rate
7.1%
Mortgage Type
FHA
Estimated Equity
$185,679
Purchase Details
Closed on
Sep 21, 1999
Sold by
Casper Randall A and Casper Sherry D
Bought by
Rogers Jeffery P
Home Financials for this Owner
Home Financials are based on the most recent Mortgage that was taken out on this home.
Original Mortgage
$56,905
Interest Rate
8.22%
Mortgage Type
New Conventional
Purchase Details
Closed on
Sep 13, 1994
Bought by
And Casper Randall A
Purchase Details
Closed on
Jan 6, 1989
Bought by
Casper Helen V
Create a Home Valuation Report for This Property
The Home Valuation Report is an in-depth analysis detailing your home's value as well as a comparison with similar homes in the area
Home Values in the Area
Average Home Value in this Area
Purchase History
| Date | Buyer | Sale Price | Title Company |
|---|---|---|---|
| Morrow Lee | $85,000 | -- | |
| Rogers Jeffery P | $59,900 | -- | |
| And Casper Randall A | $27,700 | -- | |
| Casper Helen V | $30,000 | -- |
Source: Public Records
Mortgage History
| Date | Status | Borrower | Loan Amount |
|---|---|---|---|
| Open | Morrow Lee | $84,333 | |
| Previous Owner | Rogers Jeffery P | $56,905 |
Source: Public Records
Tax History Compared to Growth
Tax History
| Year | Tax Paid | Tax Assessment Tax Assessment Total Assessment is a certain percentage of the fair market value that is determined by local assessors to be the total taxable value of land and additions on the property. | Land | Improvement |
|---|---|---|---|---|
| 2024 | $1,121 | $41,685 | $16,000 | $25,685 |
| 2023 | $641 | $41,685 | $16,000 | $25,685 |
| 2022 | $1,080 | $32,727 | $16,000 | $16,727 |
| 2021 | $825 | $25,527 | $8,800 | $16,727 |
| 2020 | $893 | $26,847 | $10,120 | $16,727 |
| 2019 | $831 | $24,656 | $10,120 | $14,536 |
| 2018 | $826 | $24,656 | $10,120 | $14,536 |
| 2017 | $667 | $22,352 | $10,120 | $12,232 |
| 2016 | $636 | $22,352 | $10,120 | $12,232 |
| 2015 | $637 | $22,352 | $10,120 | $12,232 |
| 2014 | $438 | $17,191 | $4,959 | $12,232 |
| 2013 | -- | $16,599 | $4,958 | $11,640 |
Source: Public Records
Map
Nearby Homes
- 120 2nd St
- 43 Richardson St
- 63 N Williamson St
- 194 Graham St
- 0 W Athens St Unit 10544465
- 0 Georgia Highway 211 Unit 7483562
- 200 Capitol Ave
- 118 E Kimball St
- 19 Holland Cove
- 25 Holland Cove
- 209 Georgia Ave
- 116 N Broad St
- 92 Woodlawn Ave
- 34 W Stephens St
- 18 E New St
- 29 Lighthouse Dr
- 115 N Center St
- 132 Circle Dr