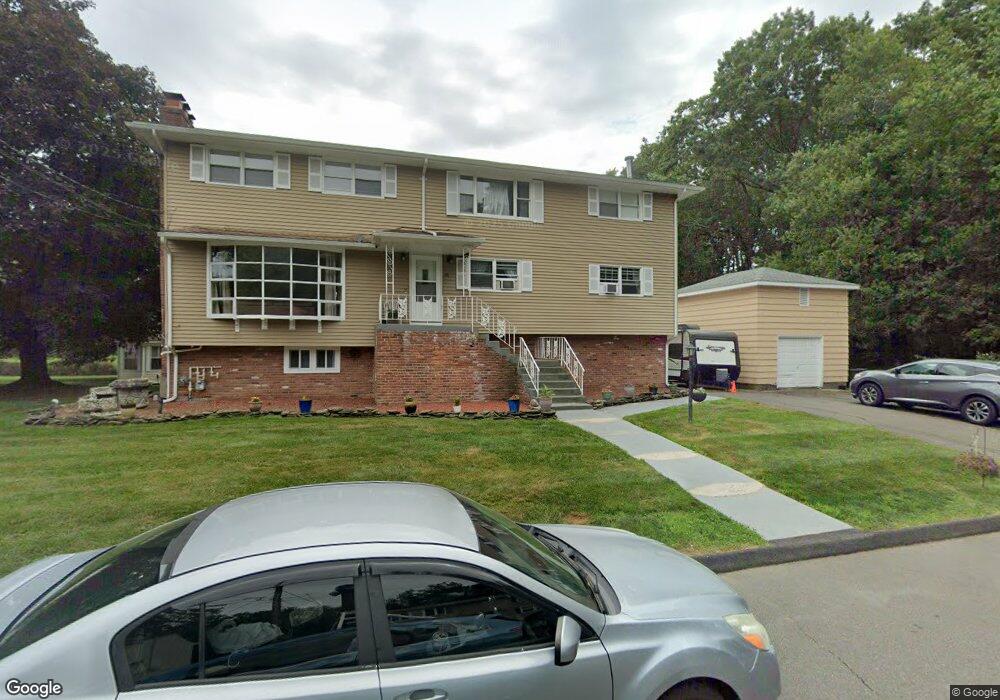
44 West St East Haven, CT 06513
Estimated Value: $421,000 - $599,389
7
Beds
3
Baths
2,803
Sq Ft
$193/Sq Ft
Est. Value
About This Home
This home is located at 44 West St, East Haven, CT 06513 and is currently estimated at $540,597, approximately $192 per square foot. 44 West St is a home located in New Haven County with nearby schools including East Haven High School and All Nations Christian Academy.
Ownership History
Date
Name
Owned For
Owner Type
Purchase Details
Closed on
Dec 19, 2006
Sold by
Jarmie Carmel A and Coyle Margaret
Bought by
Carmona Linda and Carmona Joan
Current Estimated Value
Home Financials for this Owner
Home Financials are based on the most recent Mortgage that was taken out on this home.
Original Mortgage
$346,500
Outstanding Balance
$207,165
Interest Rate
6.31%
Estimated Equity
$333,432
Create a Home Valuation Report for This Property
The Home Valuation Report is an in-depth analysis detailing your home's value as well as a comparison with similar homes in the area
Home Values in the Area
Average Home Value in this Area
Purchase History
| Date | Buyer | Sale Price | Title Company |
|---|---|---|---|
| Carmona Linda | $385,000 | -- |
Source: Public Records
Mortgage History
| Date | Status | Borrower | Loan Amount |
|---|---|---|---|
| Open | Carmona Linda | $346,500 | |
| Previous Owner | Carmona Linda | $44,000 | |
| Previous Owner | Carmona Linda | $56,000 | |
| Previous Owner | Carmona Linda | $50,000 |
Source: Public Records
Tax History Compared to Growth
Tax History
| Year | Tax Paid | Tax Assessment Tax Assessment Total Assessment is a certain percentage of the fair market value that is determined by local assessors to be the total taxable value of land and additions on the property. | Land | Improvement |
|---|---|---|---|---|
| 2025 | $8,277 | $247,520 | $42,770 | $204,750 |
| 2024 | $8,277 | $247,520 | $42,770 | $204,750 |
| 2023 | $7,723 | $247,520 | $42,770 | $204,750 |
| 2022 | $7,723 | $247,520 | $42,770 | $204,750 |
| 2021 | $6,874 | $200,710 | $35,660 | $165,050 |
| 2020 | $6,874 | $200,710 | $35,660 | $165,050 |
| 2019 | $6,507 | $200,710 | $35,660 | $165,050 |
| 2018 | $6,513 | $200,710 | $35,660 | $165,050 |
| 2017 | $6,332 | $200,710 | $35,660 | $165,050 |
| 2016 | $5,955 | $188,740 | $39,230 | $149,510 |
| 2015 | $5,955 | $188,740 | $39,230 | $149,510 |
| 2014 | $6,049 | $188,740 | $39,230 | $149,510 |
Source: Public Records
Map
Nearby Homes
- 9 Dell Dr
- 1445 Quinnipiac Ave
- 1423 Quinnipiac Ave Unit 115
- 1423 Quinnipiac Ave Unit 709
- 1423 Quinnipiac Ave Unit 602
- 1423 Quinnipiac Ave Unit 707
- 1423 Quinnipiac Ave Unit 508
- 1423 Quinnipiac Ave Unit 103
- 1423 Quinnipiac Ave Unit 108
- 1423 Quinnipiac Ave Unit 808
- 66 John St
- 173 Russo Ave Unit 610
- 173 Russo Ave Unit 409
- 300 Foxon Hill Rd
- 140 Thompson St Unit 16E
- 140 Thompson St Unit 14A
- 140 Thompson St Unit 13C
- 140 Thompson St Unit 5B
- 140 Thompson St Unit 26B
- 242 Barnes Ave