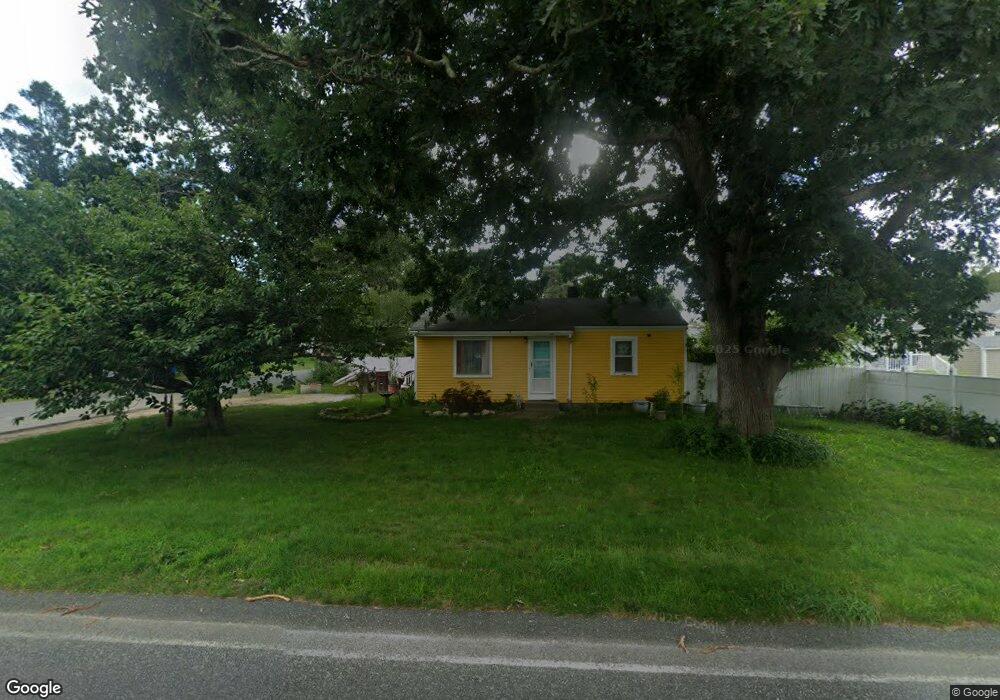
44 Wing Rd Acushnet, MA 02743
Estimated Value: $338,000 - $449,000
2
Beds
1
Bath
1,049
Sq Ft
$368/Sq Ft
Est. Value
About This Home
This home is located at 44 Wing Rd, Acushnet, MA 02743 and is currently estimated at $386,550, approximately $368 per square foot. 44 Wing Rd is a home located in Bristol County with nearby schools including Acushnet Elementary School, Albert F Ford Middle School, and Alma Del Mar Charter School.
Ownership History
Date
Name
Owned For
Owner Type
Purchase Details
Closed on
Dec 16, 2025
Sold by
Paine Kera M
Bought by
Yahweh Properties Llc
Current Estimated Value
Home Financials for this Owner
Home Financials are based on the most recent Mortgage that was taken out on this home.
Original Mortgage
$325,000
Outstanding Balance
$324,687
Interest Rate
6.17%
Mortgage Type
Commercial
Estimated Equity
$61,863
Purchase Details
Closed on
Aug 26, 2009
Sold by
Gonsalves Juliette and Hotte Linda M
Bought by
Paine Charles L and Paine Kera M
Home Financials for this Owner
Home Financials are based on the most recent Mortgage that was taken out on this home.
Original Mortgage
$168,393
Interest Rate
5.17%
Mortgage Type
Purchase Money Mortgage
Purchase Details
Closed on
Mar 26, 2007
Sold by
Gonsalves Juliette
Bought by
Vieira Carole A and Gonsalves Juliette
Create a Home Valuation Report for This Property
The Home Valuation Report is an in-depth analysis detailing your home's value as well as a comparison with similar homes in the area
Home Values in the Area
Average Home Value in this Area
Purchase History
| Date | Buyer | Sale Price | Title Company |
|---|---|---|---|
| Yahweh Properties Llc | $225,000 | -- | |
| Paine Kera M | -- | -- | |
| Paine Charles L | $171,500 | -- | |
| Vieira Carole A | -- | -- |
Source: Public Records
Mortgage History
| Date | Status | Borrower | Loan Amount |
|---|---|---|---|
| Open | Yahweh Properties Llc | $325,000 | |
| Previous Owner | Vieira Carole A | $168,393 |
Source: Public Records
Tax History
| Year | Tax Paid | Tax Assessment Tax Assessment Total Assessment is a certain percentage of the fair market value that is determined by local assessors to be the total taxable value of land and additions on the property. | Land | Improvement |
|---|---|---|---|---|
| 2025 | $30 | $274,600 | $100,800 | $173,800 |
| 2024 | $2,886 | $252,900 | $96,400 | $156,500 |
| 2023 | $2,788 | $232,300 | $87,700 | $144,600 |
| 2022 | $2,779 | $209,400 | $83,300 | $126,100 |
| 2021 | $2,493 | $194,900 | $83,300 | $111,600 |
| 2020 | $2,717 | $194,900 | $83,300 | $111,600 |
| 2019 | $2,657 | $187,400 | $83,300 | $104,100 |
| 2018 | $2,575 | $178,600 | $83,300 | $95,300 |
| 2017 | $2,487 | $172,200 | $83,300 | $88,900 |
| 2016 | $2,425 | $166,900 | $83,300 | $83,600 |
| 2015 | $2,305 | $161,400 | $83,300 | $78,100 |
Source: Public Records
Map
Nearby Homes
Your Personal Tour Guide
Ask me questions while you tour the home.