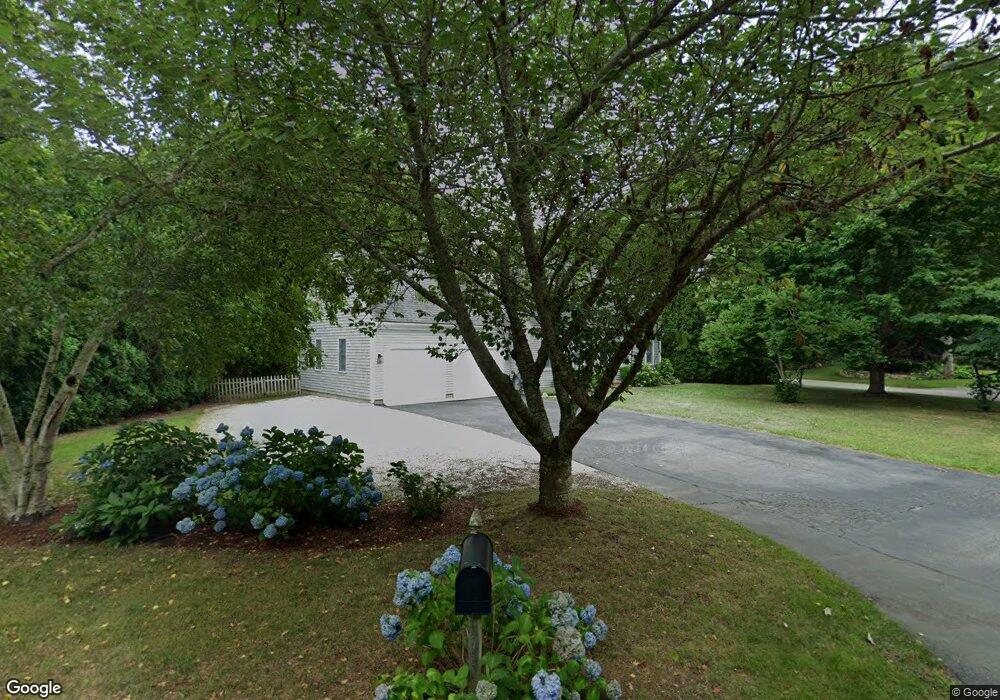
44 Wohelo Dr North Falmouth, MA 02556
North Falmouth NeighborhoodEstimated Value: $862,440 - $948,000
4
Beds
2
Baths
1,501
Sq Ft
$595/Sq Ft
Est. Value
About This Home
This home is located at 44 Wohelo Dr, North Falmouth, MA 02556 and is currently estimated at $893,360, approximately $595 per square foot. 44 Wohelo Dr is a home located in Barnstable County with nearby schools including North Falmouth Elementary School, Morse Pond School, and Lawrence School.
Ownership History
Date
Name
Owned For
Owner Type
Purchase Details
Closed on
Apr 3, 2003
Sold by
Kezerian Thomas and Kezerian Arshalous Q
Bought by
Karson Douglas C and Karson Karen P
Current Estimated Value
Purchase Details
Closed on
Feb 28, 2000
Sold by
Drinan William and Drinan Nancy J
Bought by
Kezerian Arshalous Q and Kezerian Thomas
Purchase Details
Closed on
May 9, 1997
Sold by
Kelley Alice L
Bought by
Drinan William and Drinan Nancy J
Create a Home Valuation Report for This Property
The Home Valuation Report is an in-depth analysis detailing your home's value as well as a comparison with similar homes in the area
Home Values in the Area
Average Home Value in this Area
Purchase History
| Date | Buyer | Sale Price | Title Company |
|---|---|---|---|
| Karson Douglas C | $400,000 | -- | |
| Karson Douglas C | $400,000 | -- | |
| Kezerian Arshalous Q | $278,000 | -- | |
| Kezerian Arshalous Q | $278,000 | -- | |
| Drinan William | $66,000 | -- | |
| Drinan William | $66,000 | -- |
Source: Public Records
Mortgage History
| Date | Status | Borrower | Loan Amount |
|---|---|---|---|
| Open | Drinan William | $310,000 | |
| Closed | Drinan William | $310,000 |
Source: Public Records
Tax History Compared to Growth
Tax History
| Year | Tax Paid | Tax Assessment Tax Assessment Total Assessment is a certain percentage of the fair market value that is determined by local assessors to be the total taxable value of land and additions on the property. | Land | Improvement |
|---|---|---|---|---|
| 2025 | $4,456 | $759,100 | $265,200 | $493,900 |
| 2024 | $4,290 | $683,200 | $232,100 | $451,100 |
| 2023 | $3,960 | $572,200 | $182,300 | $389,900 |
| 2022 | $3,826 | $475,300 | $160,700 | $314,600 |
| 2021 | $3,621 | $426,000 | $147,300 | $278,700 |
| 2020 | $3,544 | $412,600 | $133,900 | $278,700 |
| 2019 | $3,478 | $406,300 | $133,900 | $272,400 |
| 2018 | $3,361 | $390,800 | $133,900 | $256,900 |
| 2017 | $3,241 | $380,000 | $133,900 | $246,100 |
| 2016 | $3,181 | $380,000 | $133,900 | $246,100 |
| 2015 | $3,112 | $380,000 | $133,900 | $246,100 |
| 2014 | $3,186 | $390,900 | $140,900 | $250,000 |
Source: Public Records
Map
Nearby Homes