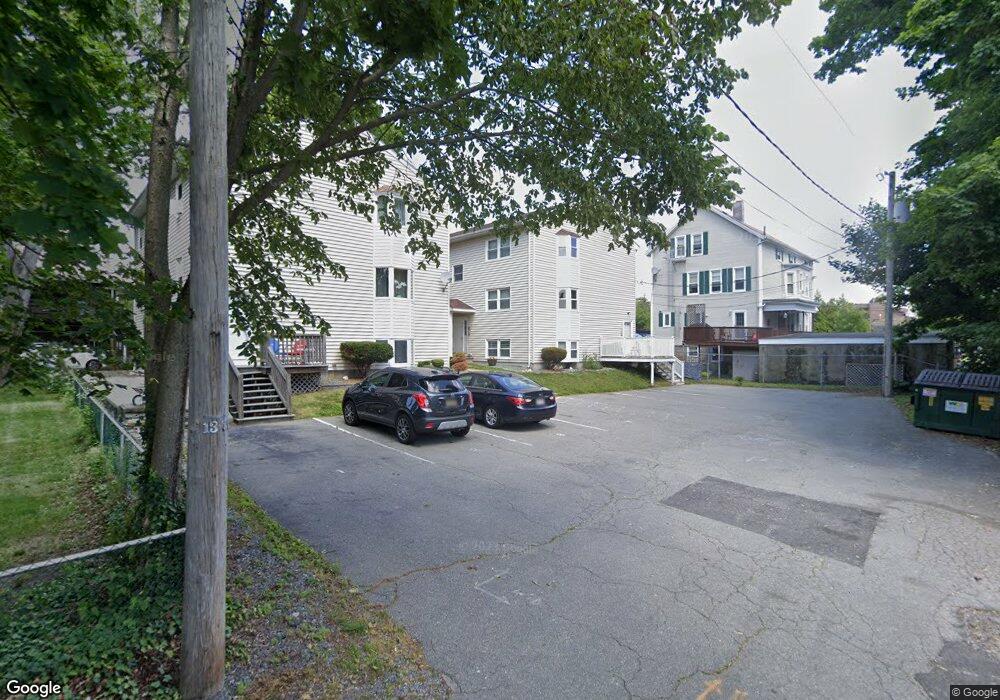
44 Woodbine Place Unit 2 Fall River, MA 02720
Bank Street NeighborhoodEstimated Value: $314,000 - $322,872
3
Beds
1
Bath
1,063
Sq Ft
$299/Sq Ft
Est. Value
About This Home
This home is located at 44 Woodbine Place Unit 2, Fall River, MA 02720 and is currently estimated at $317,718, approximately $298 per square foot. 44 Woodbine Place Unit 2 is a home located in Bristol County with nearby schools including Mary Fonseca Elementary School, Morton Middle School, and B M C Durfee High School.
Ownership History
Date
Name
Owned For
Owner Type
Purchase Details
Closed on
Jan 22, 2024
Sold by
Bernier Roger E and Bernier Pamela
Bought by
Keets Stacy A and Bernier Troy E
Current Estimated Value
Purchase Details
Closed on
Jan 30, 2006
Sold by
Wilson Stephen G
Bought by
Bernier Pamela and Bernier Roger E
Home Financials for this Owner
Home Financials are based on the most recent Mortgage that was taken out on this home.
Original Mortgage
$137,600
Interest Rate
6.34%
Mortgage Type
Purchase Money Mortgage
Purchase Details
Closed on
Nov 22, 2002
Sold by
Braga Antonio M and Braga Maria J
Bought by
Wilson Stephen G
Home Financials for this Owner
Home Financials are based on the most recent Mortgage that was taken out on this home.
Original Mortgage
$126,350
Interest Rate
6.07%
Mortgage Type
Purchase Money Mortgage
Create a Home Valuation Report for This Property
The Home Valuation Report is an in-depth analysis detailing your home's value as well as a comparison with similar homes in the area
Home Values in the Area
Average Home Value in this Area
Purchase History
| Date | Buyer | Sale Price | Title Company |
|---|---|---|---|
| Keets Stacy A | -- | None Available | |
| Bernier Pamela | $172,000 | -- | |
| Wilson Stephen G | $133,000 | -- |
Source: Public Records
Mortgage History
| Date | Status | Borrower | Loan Amount |
|---|---|---|---|
| Previous Owner | Bernier Pamela | $137,600 | |
| Previous Owner | Wilson Stephen G | $126,350 |
Source: Public Records
Tax History Compared to Growth
Tax History
| Year | Tax Paid | Tax Assessment Tax Assessment Total Assessment is a certain percentage of the fair market value that is determined by local assessors to be the total taxable value of land and additions on the property. | Land | Improvement |
|---|---|---|---|---|
| 2025 | $2,757 | $240,800 | $0 | $240,800 |
| 2024 | $2,678 | $233,100 | $0 | $233,100 |
| 2023 | $2,590 | $211,100 | $0 | $211,100 |
| 2022 | $2,713 | $215,000 | $0 | $215,000 |
| 2021 | $2,379 | $172,000 | $0 | $172,000 |
| 2020 | $2,101 | $145,400 | $0 | $145,400 |
| 2019 | $2,041 | $140,000 | $0 | $140,000 |
| 2018 | $1,972 | $134,900 | $0 | $134,900 |
| 2017 | $1,686 | $120,400 | $0 | $120,400 |
| 2016 | $1,595 | $117,000 | $0 | $117,000 |
| 2015 | $1,563 | $119,500 | $0 | $119,500 |
| 2014 | $1,622 | $128,900 | $0 | $128,900 |
Source: Public Records
Map
Nearby Homes
- 44 Woodbine Place
- 44 Woodbine Place Unit 3
- 44 Woodbine Place Unit 1
- 30 Woodbine Place Unit 3
- 30 Woodbine Place Unit 2
- 30 Woodbine Place Unit 1
- 30 Woodbine Place Unit 2 -30
- 484 Linden St
- 496 Linden St
- 468 Linden St
- 468 Linden St Unit 3
- 468 Linden St
- 468 Linden St Unit 1
- 468 Linden St Unit 2
- 431 Prospect St
- 500 Linden St
- 506 Linden St
- 31 Woodbine Place
- 462 Linden St
- 443 Prospect St