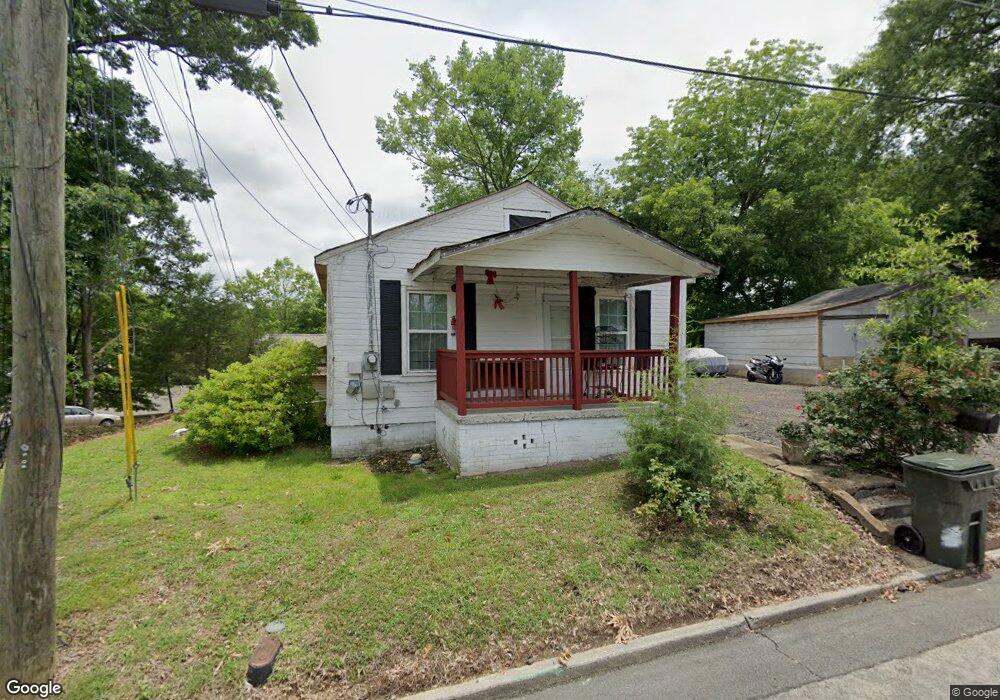
440 Benton St Dalton, GA 30720
Estimated Value: $98,000 - $145,734
2
Beds
1
Bath
876
Sq Ft
$146/Sq Ft
Est. Value
About This Home
This home is located at 440 Benton St, Dalton, GA 30720 and is currently estimated at $127,934, approximately $146 per square foot. 440 Benton St is a home located in Whitfield County with nearby schools including Westwood Elementary School, Dalton High School, and Rock Hill School.
Ownership History
Date
Name
Owned For
Owner Type
Purchase Details
Closed on
Oct 2, 2015
Sold by
Henson Jackie T
Bought by
Haikal Johnny G
Current Estimated Value
Home Financials for this Owner
Home Financials are based on the most recent Mortgage that was taken out on this home.
Original Mortgage
$28,000
Interest Rate
3.93%
Mortgage Type
New Conventional
Purchase Details
Closed on
Oct 26, 2004
Sold by
Henson Jackie
Bought by
Henson Jackie T and Henson Billy C
Purchase Details
Closed on
Oct 2, 2002
Sold by
Robertson Paul E
Bought by
Henson Jackie T and Henson Billy C
Purchase Details
Closed on
Sep 1, 1994
Bought by
Robertson Paul E
Create a Home Valuation Report for This Property
The Home Valuation Report is an in-depth analysis detailing your home's value as well as a comparison with similar homes in the area
Purchase History
| Date | Buyer | Sale Price | Title Company |
|---|---|---|---|
| Haikal Johnny G | $35,000 | -- | |
| Henson Jackie T | -- | -- | |
| Henson Jackie T | $50,000 | -- | |
| Robertson Paul E | $20,000 | -- |
Source: Public Records
Mortgage History
| Date | Status | Borrower | Loan Amount |
|---|---|---|---|
| Closed | Haikal Johnny G | $28,000 |
Source: Public Records
Tax History
| Year | Tax Paid | Tax Assessment Tax Assessment Total Assessment is a certain percentage of the fair market value that is determined by local assessors to be the total taxable value of land and additions on the property. | Land | Improvement |
|---|---|---|---|---|
| 2025 | $1,331 | $41,591 | $8,000 | $33,591 |
| 2024 | $1,331 | $41,591 | $8,000 | $33,591 |
| 2023 | $635 | $18,442 | $5,400 | $13,042 |
| 2022 | $627 | $18,194 | $5,400 | $12,794 |
| 2021 | $628 | $18,194 | $5,400 | $12,794 |
| 2020 | $652 | $18,194 | $5,400 | $12,794 |
| 2019 | $625 | $16,906 | $5,400 | $11,506 |
| 2018 | $634 | $16,906 | $5,400 | $11,506 |
| 2017 | $715 | $16,906 | $5,400 | $11,506 |
| 2016 | $509 | $16,672 | $3,570 | $13,102 |
| 2014 | $550 | $16,672 | $3,570 | $13,102 |
| 2013 | -- | $16,671 | $3,570 | $13,101 |
Source: Public Records
Map
Nearby Homes
- 436 Benton St
- 508 Benton St
- 510 Benton St
- 437 Benton St
- 430 Benton St
- 431 Benton St
- 439 Benton St
- 514 Benton St
- 435 Benton St
- 441 Benton St
- 501 Benton St
- 443 N Thornton Ave
- 426 Benton St
- 426 Benton St Unit 1
- 439 N Thornton Ave
- 424 Benton St
- 411 W Tyler St
- 608 Jones St
- 446 N Thornton Ave
- 610 Jones St
Your Personal Tour Guide
Ask me questions while you tour the home.