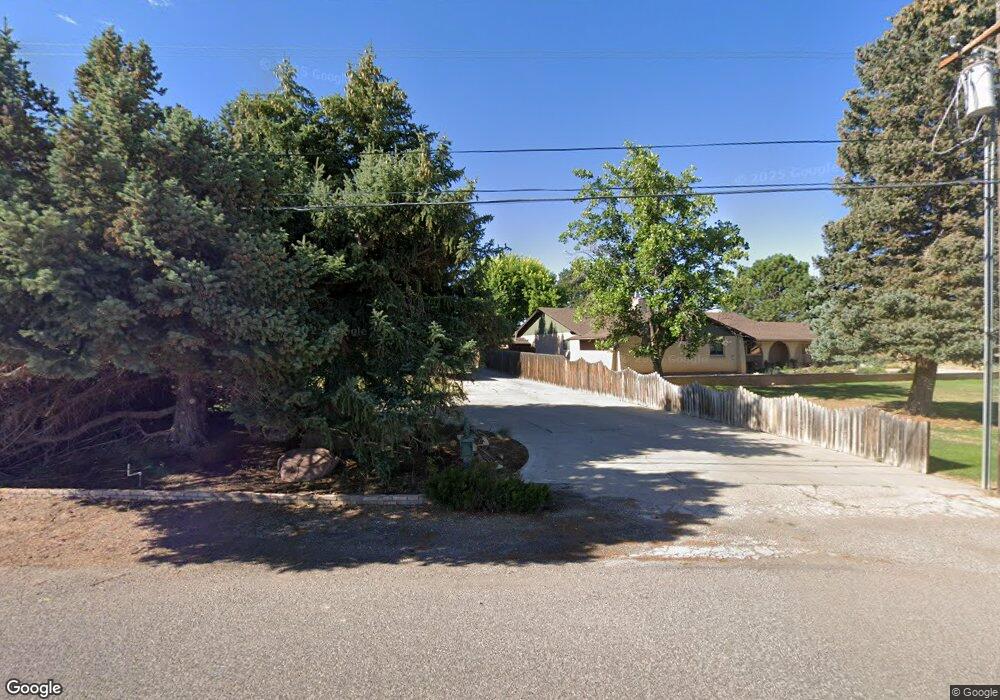
440 Canyon Rd Fillmore, UT 84631
Estimated Value: $437,000 - $1,312,000
4
Beds
2
Baths
3,366
Sq Ft
$260/Sq Ft
Est. Value
About This Home
This home is located at 440 Canyon Rd, Fillmore, UT 84631 and is currently estimated at $874,500, approximately $259 per square foot. 440 Canyon Rd is a home located in Millard County.
Ownership History
Date
Name
Owned For
Owner Type
Purchase Details
Closed on
Mar 14, 2024
Sold by
Molly S Hinton Family Trust
Bought by
Hinton Darby Shannon
Current Estimated Value
Purchase Details
Closed on
Dec 23, 2016
Sold by
Waddoups Hinton Arvid and Hinton Molly S
Bought by
Hinton Arvid W and Hinton Molly S
Create a Home Valuation Report for This Property
The Home Valuation Report is an in-depth analysis detailing your home's value as well as a comparison with similar homes in the area
Home Values in the Area
Average Home Value in this Area
Purchase History
| Date | Buyer | Sale Price | Title Company |
|---|---|---|---|
| Hinton Darby Shannon | -- | None Listed On Document | |
| Hinton Arvid W | -- | -- |
Source: Public Records
Tax History Compared to Growth
Tax History
| Year | Tax Paid | Tax Assessment Tax Assessment Total Assessment is a certain percentage of the fair market value that is determined by local assessors to be the total taxable value of land and additions on the property. | Land | Improvement |
|---|---|---|---|---|
| 2025 | $2,325 | $291,953 | $45,100 | $246,853 |
| 2024 | $2,325 | $249,848 | $25,755 | $224,093 |
| 2023 | $2,648 | $249,848 | $25,755 | $224,093 |
| 2022 | $1,936 | $173,798 | $23,414 | $150,384 |
| 2021 | $1,763 | $151,968 | $19,511 | $132,457 |
| 2020 | $1,628 | $141,182 | $17,738 | $123,444 |
| 2019 | $1,386 | $120,567 | $17,738 | $102,829 |
| 2018 | $1,318 | $117,330 | $17,738 | $99,592 |
| 2017 | $1,300 | $110,066 | $17,738 | $92,328 |
| 2016 | $1,244 | $110,066 | $17,738 | $92,328 |
| 2015 | $1,244 | $110,066 | $17,738 | $92,328 |
| 2014 | -- | $110,066 | $17,738 | $92,328 |
| 2013 | -- | $110,066 | $17,738 | $92,328 |
Source: Public Records
Map
Nearby Homes
- 430 E Canyon Rd
- 310 S 600 E
- 220 S 200 E
- 405 E 500 St S
- 690 E 500 S
- 157 E 500 South St
- 155 E 500 St S
- 40 S 100 Rd E
- 750 800 South Fillmore
- 825 800 South Fillmore
- 800 800 South Fillmore
- 760 E 700 St S
- 190 W 400 St S
- 165 N 100 W
- 295 N 100 West St
- 225 W 200 St N
- 390 N 100 W
- 380 N 200 St W
- 310 S 500 West Rd
- 335 W 400 North St