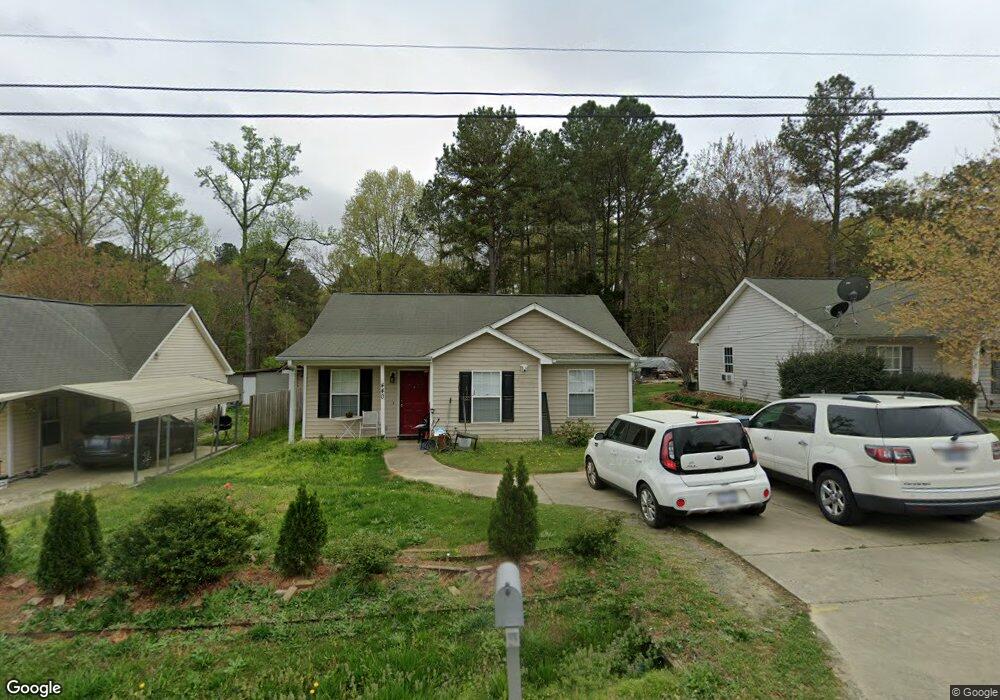
440 Craven St Durham, NC 27704
Northeast Durham NeighborhoodEstimated Value: $235,000 - $273,620
3
Beds
2
Baths
1,120
Sq Ft
$224/Sq Ft
Est. Value
About This Home
This home is located at 440 Craven St, Durham, NC 27704 and is currently estimated at $250,405, approximately $223 per square foot. 440 Craven St is a home located in Durham County with nearby schools including Sandy Ridge Elementary School, Lucas Middle School, and Northern High School.
Ownership History
Date
Name
Owned For
Owner Type
Purchase Details
Closed on
Apr 30, 2008
Sold by
American Home Mortgage Servicing Inc
Bought by
Vega Armando Garcia and Osegueda Barajas Maria E
Current Estimated Value
Home Financials for this Owner
Home Financials are based on the most recent Mortgage that was taken out on this home.
Original Mortgage
$84,360
Outstanding Balance
$53,815
Interest Rate
6.02%
Mortgage Type
Purchase Money Mortgage
Estimated Equity
$196,590
Purchase Details
Closed on
Nov 6, 2007
Sold by
Perez Lopez Gustavo
Bought by
American Home Mortgage Servicing Inc
Purchase Details
Closed on
Oct 19, 2005
Sold by
Roberts Donald G
Bought by
Perez Lopez Gustavo
Home Financials for this Owner
Home Financials are based on the most recent Mortgage that was taken out on this home.
Original Mortgage
$109,250
Interest Rate
7%
Mortgage Type
Fannie Mae Freddie Mac
Purchase Details
Closed on
Aug 2, 2004
Sold by
Atwater Marcella M
Bought by
Newman Tyrone
Create a Home Valuation Report for This Property
The Home Valuation Report is an in-depth analysis detailing your home's value as well as a comparison with similar homes in the area
Home Values in the Area
Average Home Value in this Area
Purchase History
| Date | Buyer | Sale Price | Title Company |
|---|---|---|---|
| Vega Armando Garcia | $80,000 | None Available | |
| American Home Mortgage Servicing Inc | $99,299 | None Available | |
| Perez Lopez Gustavo | $115,000 | -- | |
| Newman Tyrone | $73,000 | -- |
Source: Public Records
Mortgage History
| Date | Status | Borrower | Loan Amount |
|---|---|---|---|
| Open | Vega Armando Garcia | $84,360 | |
| Previous Owner | Perez Lopez Gustavo | $109,250 |
Source: Public Records
Tax History Compared to Growth
Tax History
| Year | Tax Paid | Tax Assessment Tax Assessment Total Assessment is a certain percentage of the fair market value that is determined by local assessors to be the total taxable value of land and additions on the property. | Land | Improvement |
|---|---|---|---|---|
| 2025 | $2,325 | $234,574 | $73,125 | $161,449 |
| 2024 | $1,808 | $129,630 | $17,565 | $112,065 |
| 2023 | $1,698 | $129,630 | $17,565 | $112,065 |
| 2022 | $1,659 | $129,630 | $17,565 | $112,065 |
| 2021 | $1,651 | $129,630 | $17,565 | $112,065 |
| 2020 | $1,612 | $129,630 | $17,565 | $112,065 |
| 2019 | $1,612 | $129,630 | $17,565 | $112,065 |
| 2018 | $1,208 | $89,078 | $17,565 | $71,513 |
| 2017 | $1,199 | $89,078 | $17,565 | $71,513 |
| 2016 | $1,159 | $89,078 | $17,565 | $71,513 |
| 2015 | $1,584 | $114,400 | $16,680 | $97,720 |
| 2014 | $1,584 | $114,400 | $16,680 | $97,720 |
Source: Public Records
Map
Nearby Homes
- 513 Usher St
- 3231 Dearborn Dr
- 3609 Cub Creek Rd
- 3615 Cub Creek Rd
- 3014 Lake Dr
- 511 Usher St
- 2801 Cannada Ave
- 3024 3026 Ruth St
- 928 Belvin Ave
- 1020 Raven St
- 2706 Thelma St
- 2906 Apollo St
- 810 Berwyn Ave
- 1324 Maplewood Dr
- 618 Belvin Ave
- 2726 Thelma St
- 2224 Clements Dr
- 700 Toronto Ave
- 4157 Trevino Dr
- 2609 Kingdom Way