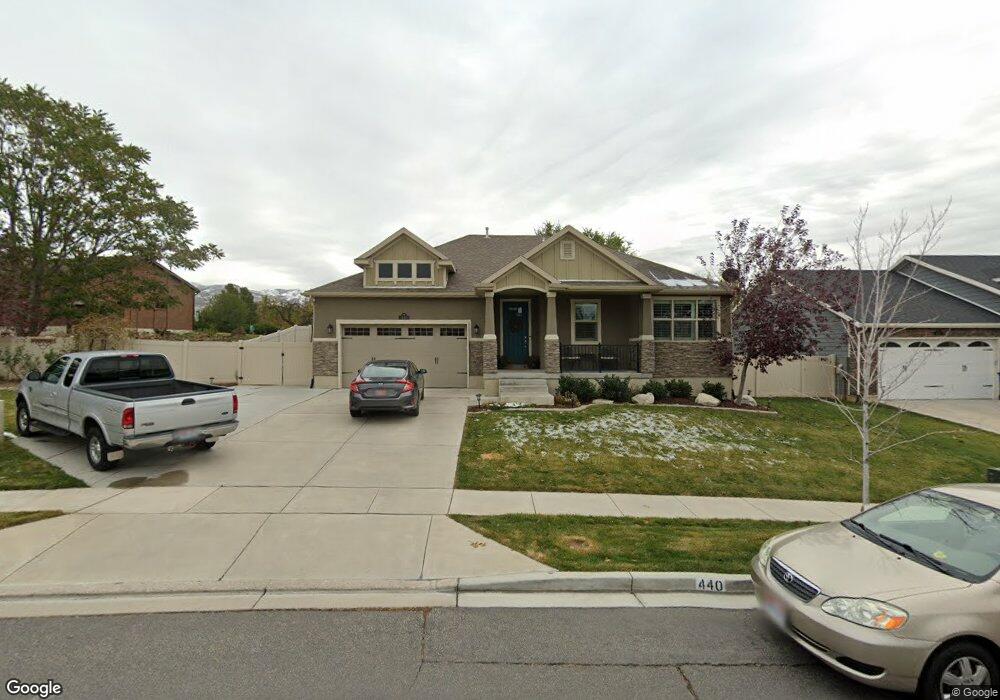
440 E 550 N Bountiful, UT 84010
Estimated Value: $788,000 - $846,000
3
Beds
3
Baths
2,060
Sq Ft
$397/Sq Ft
Est. Value
About This Home
This home is located at 440 E 550 N, Bountiful, UT 84010 and is currently estimated at $817,980, approximately $397 per square foot. 440 E 550 N is a home with nearby schools including Tolman School, Bountiful Junior High School, and Bountiful High School.
Ownership History
Date
Name
Owned For
Owner Type
Purchase Details
Closed on
Oct 14, 2020
Sold by
Jones Gregg Todd and Jones Stephanie Miller
Bought by
Jones Greg and Jones Stephanie
Current Estimated Value
Home Financials for this Owner
Home Financials are based on the most recent Mortgage that was taken out on this home.
Original Mortgage
$267,000
Outstanding Balance
$190,535
Interest Rate
2.9%
Mortgage Type
New Conventional
Estimated Equity
$627,445
Purchase Details
Closed on
Apr 5, 2019
Sold by
Nyberg David and Nyberg Michelle
Bought by
Miller Jones Greg Todd and Miller Jones Stephanie
Home Financials for this Owner
Home Financials are based on the most recent Mortgage that was taken out on this home.
Original Mortgage
$273,000
Interest Rate
4.3%
Mortgage Type
New Conventional
Purchase Details
Closed on
May 28, 2014
Sold by
G M W Development Inc
Bought by
Oakwood Homes Of Utah Llc
Purchase Details
Closed on
Aug 30, 2013
Sold by
Gmw Development Inc
Bought by
South Davis Sewer District
Create a Home Valuation Report for This Property
The Home Valuation Report is an in-depth analysis detailing your home's value as well as a comparison with similar homes in the area
Purchase History
| Date | Buyer | Sale Price | Title Company |
|---|---|---|---|
| Jones Greg | -- | Title Guarantee La | |
| Miller Jones Greg Todd | -- | Title Guarantee La | |
| Oakwood Homes Of Utah Llc | -- | Cottonwood Title Ins | |
| South Davis Sewer District | -- | None Available |
Source: Public Records
Mortgage History
| Date | Status | Borrower | Loan Amount |
|---|---|---|---|
| Open | Jones Greg | $267,000 | |
| Closed | Miller Jones Greg Todd | $273,000 |
Source: Public Records
Tax History
| Year | Tax Paid | Tax Assessment Tax Assessment Total Assessment is a certain percentage of the fair market value that is determined by local assessors to be the total taxable value of land and additions on the property. | Land | Improvement |
|---|---|---|---|---|
| 2025 | $4,862 | $438,350 | $186,572 | $251,778 |
| 2024 | $4,629 | $430,651 | $171,067 | $259,584 |
| 2023 | $4,622 | $783,000 | $322,863 | $460,137 |
| 2022 | $4,875 | $454,300 | $173,733 | $280,567 |
| 2021 | $3,790 | $536,000 | $259,335 | $276,665 |
| 2020 | $3,344 | $473,000 | $235,848 | $237,152 |
| 2019 | $3,816 | $533,000 | $204,895 | $328,105 |
| 2018 | $3,884 | $537,000 | $193,866 | $343,134 |
| 2016 | $3,397 | $254,540 | $73,458 | $181,082 |
| 2015 | $3,477 | $246,785 | $73,458 | $173,327 |
| 2014 | $1,932 | $133,560 | $133,560 | $0 |
Source: Public Records
Map
Nearby Homes
Your Personal Tour Guide
Ask me questions while you tour the home.