Estimated Value: $372,000 - $397,000
4
Beds
2
Baths
1,234
Sq Ft
$311/Sq Ft
Est. Value
About This Home
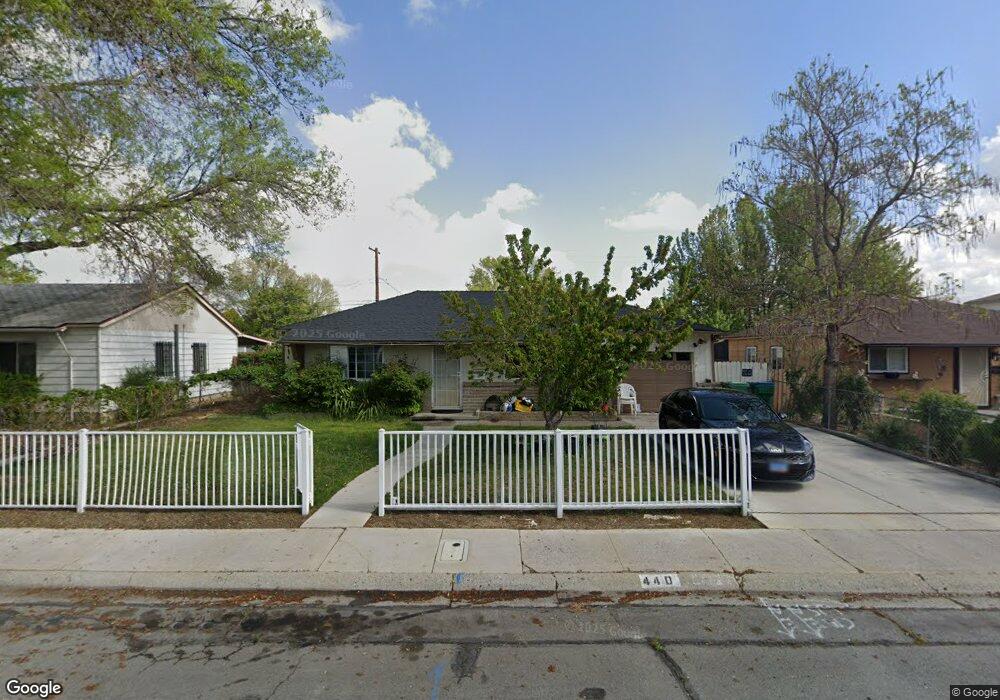
This home is located at 440 L St, Sparks, NV 89431 and is currently estimated at $384,267, approximately $311 per square foot. 440 L St is a home located in Washoe County with nearby schools including Greenbrae Elementary School, George L Dilworth Middle School, and Sparks High School.
Ownership History
Date
Name
Owned For
Owner Type
Purchase Details
Closed on
Sep 29, 2009
Sold by
Federal Home Loan Mortgage Corporation
Bought by
Manuta Perfecto P and Pilongo Ligoria
Current Estimated Value
Home Financials for this Owner
Home Financials are based on the most recent Mortgage that was taken out on this home.
Original Mortgage
$93,279
Outstanding Balance
$60,164
Interest Rate
5.08%
Mortgage Type
FHA
Estimated Equity
$324,103
Purchase Details
Closed on
Jul 15, 2009
Sold by
Murillo Isabel and Murillo Parada Sergio
Bought by
Federal Home Loan Mortgage Corporation
Purchase Details
Closed on
Oct 22, 2004
Sold by
Murillo Isabel
Bought by
Murillo Parada Sergio and Murillo Isabel
Home Financials for this Owner
Home Financials are based on the most recent Mortgage that was taken out on this home.
Original Mortgage
$148,500
Interest Rate
5.65%
Mortgage Type
New Conventional
Purchase Details
Closed on
Sep 27, 2002
Sold by
Murillo Sergio
Bought by
Murillo Isabel
Home Financials for this Owner
Home Financials are based on the most recent Mortgage that was taken out on this home.
Original Mortgage
$132,133
Interest Rate
6.16%
Mortgage Type
FHA
Purchase Details
Closed on
Sep 26, 2002
Sold by
Bolin Mark J and Bolin Kimberly L
Bought by
Murillo Isabel
Home Financials for this Owner
Home Financials are based on the most recent Mortgage that was taken out on this home.
Original Mortgage
$132,133
Interest Rate
6.16%
Mortgage Type
FHA
Purchase Details
Closed on
Jun 6, 1997
Sold by
Bolin Mark J
Bought by
Bolin Mark J and Bolin Kimberly L
Home Financials for this Owner
Home Financials are based on the most recent Mortgage that was taken out on this home.
Original Mortgage
$13,623
Interest Rate
7.98%
Purchase Details
Closed on
Feb 28, 1995
Sold by
Maynard Steve A
Bought by
Bolin Mark J
Home Financials for this Owner
Home Financials are based on the most recent Mortgage that was taken out on this home.
Original Mortgage
$95,194
Interest Rate
9.23%
Mortgage Type
FHA
Purchase Details
Closed on
Jan 6, 1995
Sold by
Kaai David C and Kaai Pamela
Bought by
Maynard Steve A
Home Financials for this Owner
Home Financials are based on the most recent Mortgage that was taken out on this home.
Original Mortgage
$95,194
Interest Rate
9.23%
Mortgage Type
FHA
Create a Home Valuation Report for This Property
The Home Valuation Report is an in-depth analysis detailing your home's value as well as a comparison with similar homes in the area
Home Values in the Area
Average Home Value in this Area
Purchase History
| Date | Buyer | Sale Price | Title Company |
|---|---|---|---|
| Manuta Perfecto P | $95,000 | Fidelity National Title | |
| Federal Home Loan Mortgage Corporation | $139,000 | First American National Defa | |
| Murillo Parada Sergio | -- | First Centennial Title Co | |
| Murillo Isabel | $134,000 | First Centennial Title Co | |
| Murillo Isabel | $134,000 | First Centennial Title Co | |
| Bolin Mark J | -- | Stewart Title | |
| Bolin Mark J | $97,500 | Founders Title Company | |
| Maynard Steve A | $47,342 | Founders Title Company |
Source: Public Records
Mortgage History
| Date | Status | Borrower | Loan Amount |
|---|---|---|---|
| Open | Manuta Perfecto P | $93,279 | |
| Previous Owner | Murillo Parada Sergio | $148,500 | |
| Previous Owner | Murillo Isabel | $132,133 | |
| Previous Owner | Bolin Mark J | $13,623 | |
| Previous Owner | Bolin Mark J | $95,194 | |
| Closed | Murillo Isabel | $7,150 |
Source: Public Records
Tax History
| Year | Tax Paid | Tax Assessment Tax Assessment Total Assessment is a certain percentage of the fair market value that is determined by local assessors to be the total taxable value of land and additions on the property. | Land | Improvement |
|---|---|---|---|---|
| 2026 | $521 | $50,819 | $34,090 | $16,729 |
| 2025 | $682 | $50,218 | $33,565 | $16,653 |
| 2024 | $663 | $46,467 | $30,065 | $16,402 |
| 2023 | $663 | $46,526 | $31,325 | $15,201 |
| 2022 | $646 | $38,564 | $26,180 | $12,384 |
| 2021 | $628 | $30,026 | $17,955 | $12,071 |
| 2020 | $608 | $28,783 | $16,940 | $11,843 |
| 2019 | $600 | $27,069 | $15,890 | $11,179 |
| 2018 | $573 | $22,444 | $11,725 | $10,719 |
| 2017 | $550 | $20,916 | $10,395 | $10,521 |
| 2016 | $535 | $19,893 | $9,345 | $10,548 |
| 2015 | $533 | $18,033 | $7,700 | $10,333 |
| 2014 | $519 | $16,157 | $6,440 | $9,717 |
| 2013 | -- | $13,734 | $4,270 | $9,464 |
Source: Public Records
Map
Nearby Homes
Your Personal Tour Guide
Ask me questions while you tour the home.