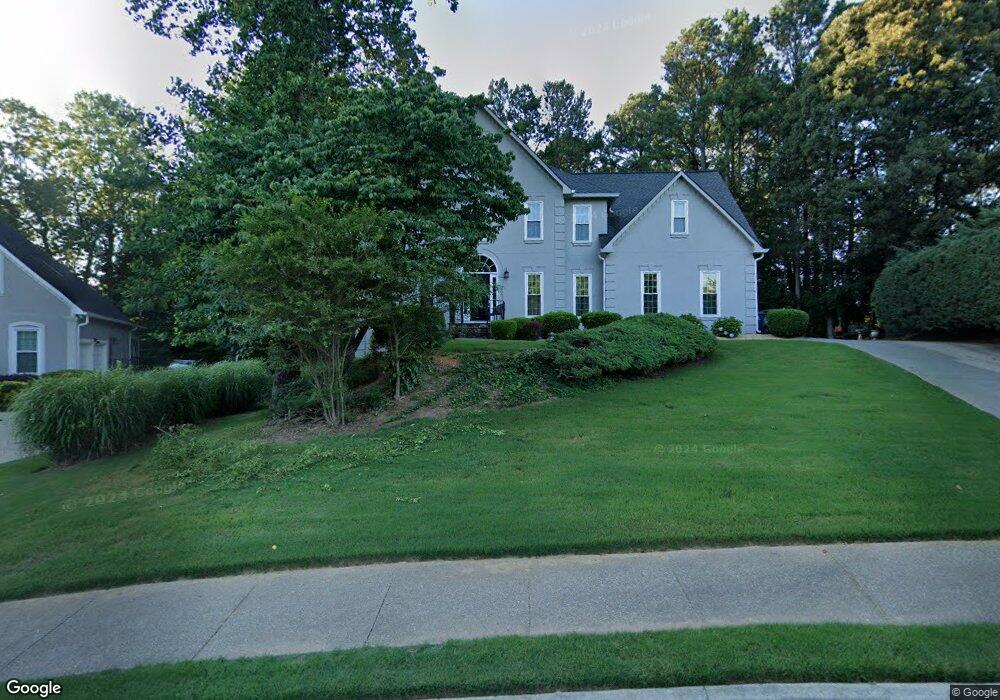
440 Laurian View Ct Roswell, GA 30075
Brookfield West NeighborhoodEstimated Value: $692,865 - $785,000
5
Beds
5
Baths
2,644
Sq Ft
$275/Sq Ft
Est. Value
About This Home
This home is located at 440 Laurian View Ct, Roswell, GA 30075 and is currently estimated at $727,466, approximately $275 per square foot. 440 Laurian View Ct is a home located in Fulton County with nearby schools including Mountain Park Elementary School, Crabapple Middle School, and Roswell High School.
Ownership History
Date
Name
Owned For
Owner Type
Purchase Details
Closed on
Apr 17, 2025
Sold by
Bollinger Charles E
Bought by
Bollinger C Trust and Bollinger Charles E Tr
Current Estimated Value
Purchase Details
Closed on
Feb 22, 2017
Sold by
Bollinger Charles Edward
Bought by
Bollinger Charles Edward and Bollinger Lindsi Rae
Purchase Details
Closed on
Apr 4, 2016
Sold by
Bollinger Charles
Bought by
Bollinger Charles
Home Financials for this Owner
Home Financials are based on the most recent Mortgage that was taken out on this home.
Original Mortgage
$225,000
Interest Rate
3.71%
Mortgage Type
New Conventional
Purchase Details
Closed on
Feb 28, 2000
Sold by
Jordan Ian R and Jordan Sally
Bought by
Bollinger Charles and Bollinger Peggy L
Home Financials for this Owner
Home Financials are based on the most recent Mortgage that was taken out on this home.
Original Mortgage
$233,200
Interest Rate
7.38%
Mortgage Type
New Conventional
Purchase Details
Closed on
Jun 6, 1996
Sold by
Humphrys Constco Inc
Bought by
Jordan Ian R Sally
Purchase Details
Closed on
Jan 18, 1996
Sold by
Mountain Park Vest Inc
Bought by
Humphrys Constco Inc
Create a Home Valuation Report for This Property
The Home Valuation Report is an in-depth analysis detailing your home's value as well as a comparison with similar homes in the area
Home Values in the Area
Average Home Value in this Area
Purchase History
| Date | Buyer | Sale Price | Title Company |
|---|---|---|---|
| Bollinger C Trust | -- | -- | |
| Bollinger Charles Edward | -- | -- | |
| Bollinger Charles | -- | -- | |
| Bollinger Charles | $291,500 | -- | |
| Jordan Ian R Sally | $254,000 | -- | |
| Humphrys Constco Inc | $45,000 | -- |
Source: Public Records
Mortgage History
| Date | Status | Borrower | Loan Amount |
|---|---|---|---|
| Previous Owner | Bollinger Charles | $225,000 | |
| Previous Owner | Bollinger Charles | $233,200 | |
| Closed | Humphrys Constco Inc | $0 |
Source: Public Records
Tax History Compared to Growth
Tax History
| Year | Tax Paid | Tax Assessment Tax Assessment Total Assessment is a certain percentage of the fair market value that is determined by local assessors to be the total taxable value of land and additions on the property. | Land | Improvement |
|---|---|---|---|---|
| 2025 | $733 | $188,800 | $47,080 | $141,720 |
| 2023 | $733 | $190,120 | $47,080 | $143,040 |
| 2022 | $3,351 | $190,120 | $47,080 | $143,040 |
| 2021 | $3,939 | $149,760 | $37,600 | $112,160 |
| 2020 | $3,895 | $136,720 | $43,640 | $93,080 |
| 2019 | $613 | $134,280 | $42,880 | $91,400 |
| 2018 | $3,361 | $131,160 | $41,880 | $89,280 |
| 2017 | $3,104 | $118,320 | $30,320 | $88,000 |
| 2016 | $3,102 | $118,320 | $30,320 | $88,000 |
| 2015 | $3,760 | $118,320 | $30,320 | $88,000 |
| 2014 | $3,236 | $118,320 | $30,320 | $88,000 |
Source: Public Records
Map
Nearby Homes
- 475 Laurian View Ct
- 1065 Laurian Park Dr
- 110 Cherry St
- 112 Cherry 0 Cherry St
- 150 Flowing Spring Trail Unit 4
- 235 Foxley Way
- 1460 Lakemist Ct
- 130 W Lake Dr
- 715 Winterwind Way
- 140 E Lake Dr
- 145 E Lake Dr
- 1945 Ledieu Rd
- 12180 Lonsdale Ln
- 1820 Azalea Springs Trail
- 2000 Trotters Ridge Way Unit 2B
- 230 Moss Stone Way Unit 2
- 4973 Gunners Pass NE
- 450 Laurian View Ct
- 430 Laurian View Ct
- 465 Laurian View Ct
- 420 Laurian View Ct
- 460 Laurian View Ct
- 455 Laurian View Ct
- 470 Laurian View Ct
- 425 Laurian View Ct
- 11970 Brookfield Club Dr
- 11985 Brookfield Club Dr
- 445 Laurian View Ct
- 435 Laurian View Ct
- 181 W Lake Dr
- 175 Axworth Ct
- 480 Laurian View Ct
- 0 Laurian View Ct Unit 7462381
- 0 Laurian View Ct Unit 7214269
- 0 Laurian View Ct Unit 3251423
- 0 Laurian View Ct Unit 8658464
- 0 Laurian View Ct Unit 8522273