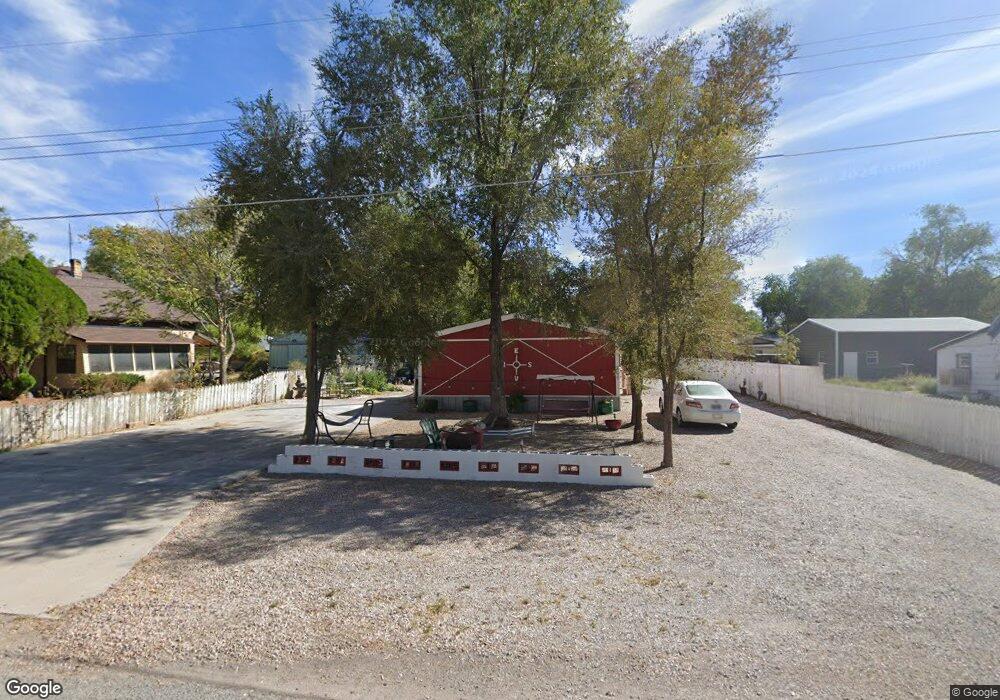
440 N 100 E Hinckley, UT 84635
Estimated Value: $249,000 - $310,000
4
Beds
2
Baths
1,848
Sq Ft
$146/Sq Ft
Est. Value
About This Home
This home is located at 440 N 100 E, Hinckley, UT 84635 and is currently estimated at $270,684, approximately $146 per square foot. 440 N 100 E is a home located in Millard County.
Ownership History
Date
Name
Owned For
Owner Type
Purchase Details
Closed on
Jun 4, 2021
Sold by
Remkes David
Bought by
Pace Dannis F and Pace Kathy
Current Estimated Value
Home Financials for this Owner
Home Financials are based on the most recent Mortgage that was taken out on this home.
Original Mortgage
$206,164
Outstanding Balance
$185,022
Interest Rate
2.9%
Mortgage Type
VA
Estimated Equity
$85,662
Purchase Details
Closed on
May 25, 2021
Sold by
440 North 100 East Hinckley Trust
Bought by
Pace Dennis F and Pace Kathy
Home Financials for this Owner
Home Financials are based on the most recent Mortgage that was taken out on this home.
Original Mortgage
$206,164
Outstanding Balance
$185,022
Interest Rate
2.9%
Mortgage Type
VA
Estimated Equity
$85,662
Purchase Details
Closed on
Dec 8, 2020
Sold by
Mcconkie Nicole Eilene
Bought by
440 North 100 East Hinckley Trust
Purchase Details
Closed on
Mar 3, 2017
Sold by
Zb Na Wealth Management
Bought by
Mcconkie Nicole Eilene and Hindman Trust
Purchase Details
Closed on
Feb 14, 2017
Sold by
Zb Na Wealth Management
Bought by
Mcconkie Nicole Eilene and Hindman Trust
Purchase Details
Closed on
Oct 20, 2010
Sold by
Hindman Kathleen Ann
Bought by
Western National Trust Company
Create a Home Valuation Report for This Property
The Home Valuation Report is an in-depth analysis detailing your home's value as well as a comparison with similar homes in the area
Purchase History
| Date | Buyer | Sale Price | Title Company |
|---|---|---|---|
| Pace Dannis F | -- | First American Title | |
| Pace Dennis F | -- | First American Title | |
| 440 North 100 East Hinckley Trust | -- | First American Equity Loan T | |
| Mcconkie Nicole Eilene | -- | -- | |
| Mcconkie Nicole Eilene | -- | -- | |
| Western National Trust Company | -- | -- |
Source: Public Records
Mortgage History
| Date | Status | Borrower | Loan Amount |
|---|---|---|---|
| Open | Pace Dannis F | $206,164 | |
| Closed | Pace Dennis F | $206,164 |
Source: Public Records
Tax History
| Year | Tax Paid | Tax Assessment Tax Assessment Total Assessment is a certain percentage of the fair market value that is determined by local assessors to be the total taxable value of land and additions on the property. | Land | Improvement |
|---|---|---|---|---|
| 2025 | $1,165 | $132,911 | $12,263 | $120,648 |
| 2024 | $1,165 | $104,869 | $5,717 | $99,152 |
| 2023 | $1,246 | $104,869 | $5,717 | $99,152 |
| 2022 | $963 | $81,426 | $5,198 | $76,228 |
| 2021 | $609 | $48,991 | $4,331 | $44,660 |
| 2020 | $538 | $43,339 | $4,125 | $39,214 |
| 2019 | $533 | $43,339 | $4,125 | $39,214 |
| 2018 | $520 | $43,339 | $4,125 | $39,214 |
| 2017 | $542 | $43,339 | $4,125 | $39,214 |
| 2016 | $519 | $43,339 | $4,125 | $39,214 |
| 2015 | $597 | $49,784 | $4,125 | $45,659 |
| 2014 | -- | $49,784 | $4,125 | $45,659 |
| 2013 | -- | $48,454 | $4,125 | $44,329 |
Source: Public Records
Map
Nearby Homes
- 289 W Center St S
- 291 W Center St
- 30 S 800 West Rd
- 861 W 75 S
- 700 Acres
- 1500 S 10000 W
- 6000 N 10000 W
- 7560 W 8500 N
- 4500 N 10000 W
- 850 W 15900 N
- 4500 N 9000 W
- 700 Acres Hwy 6 & Main St (Hwy 50)
- 2000 E 10500 N
- 6200 S 3000 W
- 18000 W Hwy 50 6
- 3480 S 4000 W
- 6177 S 3000 Rd W
- 4265 S 4000 W
- Tbd 7000 W Rd
- Tbd Highway 6-50
Your Personal Tour Guide
Ask me questions while you tour the home.