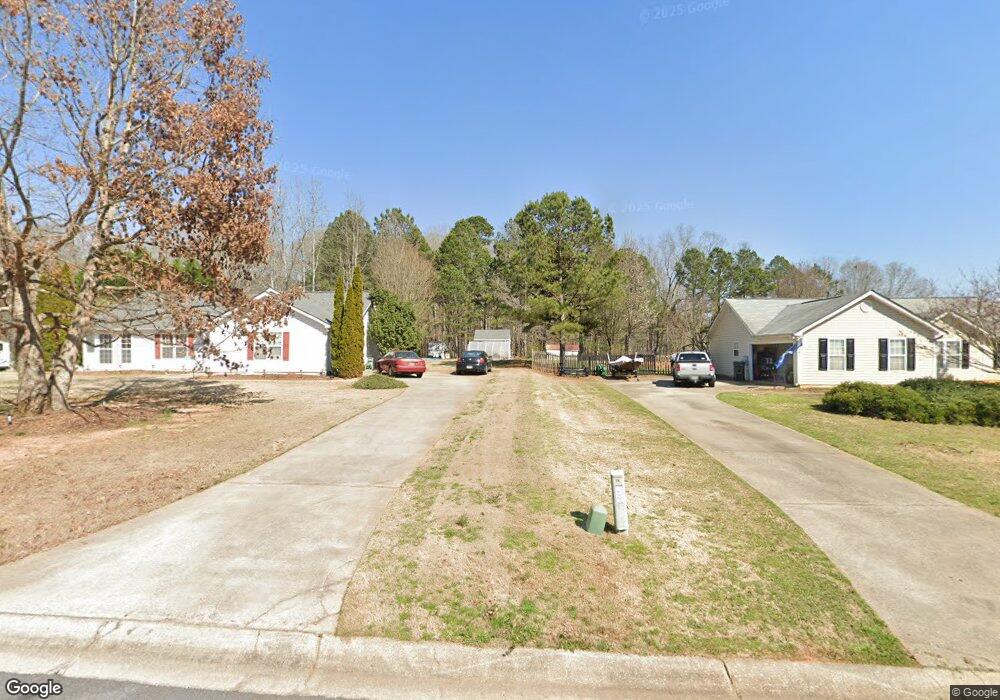
440 Peeks Crossing Dr Senoia, GA 30276
Estimated Value: $303,148 - $334,000
3
Beds
2
Baths
1,371
Sq Ft
$235/Sq Ft
Est. Value
About This Home
This home is located at 440 Peeks Crossing Dr, Senoia, GA 30276 and is currently estimated at $321,537, approximately $234 per square foot. 440 Peeks Crossing Dr is a home located in Coweta County with nearby schools including Poplar Road Elementary School, East Coweta Middle School, and East Coweta High School.
Ownership History
Date
Name
Owned For
Owner Type
Purchase Details
Closed on
Apr 22, 2002
Sold by
Webb Eric C and Webb Amy Fa
Bought by
Webb Eric C
Current Estimated Value
Home Financials for this Owner
Home Financials are based on the most recent Mortgage that was taken out on this home.
Original Mortgage
$95,100
Outstanding Balance
$40,407
Interest Rate
7.16%
Mortgage Type
New Conventional
Estimated Equity
$281,130
Purchase Details
Closed on
Mar 26, 1998
Sold by
David Lindsey Homes
Bought by
Webb Eric C and Faillo Amy
Home Financials for this Owner
Home Financials are based on the most recent Mortgage that was taken out on this home.
Original Mortgage
$95,774
Interest Rate
6.95%
Mortgage Type
New Conventional
Purchase Details
Closed on
Dec 11, 1997
Bought by
David Lindsey Homes
Purchase Details
Closed on
Nov 9, 1993
Bought by
Regional Atlanta Dev
Purchase Details
Closed on
May 31, 1986
Bought by
Sunflower Associates
Create a Home Valuation Report for This Property
The Home Valuation Report is an in-depth analysis detailing your home's value as well as a comparison with similar homes in the area
Home Values in the Area
Average Home Value in this Area
Purchase History
| Date | Buyer | Sale Price | Title Company |
|---|---|---|---|
| Webb Eric C | -- | -- | |
| Webb Eric C | $95,000 | -- | |
| David Lindsey Homes | $145,300 | -- | |
| Regional Atlanta Dev | $170,700 | -- | |
| Sunflower Associates | -- | -- |
Source: Public Records
Mortgage History
| Date | Status | Borrower | Loan Amount |
|---|---|---|---|
| Open | Webb Eric C | $95,100 | |
| Closed | Webb Eric C | $95,100 | |
| Previous Owner | Webb Eric C | $95,774 |
Source: Public Records
Tax History Compared to Growth
Tax History
| Year | Tax Paid | Tax Assessment Tax Assessment Total Assessment is a certain percentage of the fair market value that is determined by local assessors to be the total taxable value of land and additions on the property. | Land | Improvement |
|---|---|---|---|---|
| 2024 | $2,468 | $110,922 | $24,000 | $86,922 |
| 2023 | $2,468 | $102,036 | $20,000 | $82,036 |
| 2022 | $2,081 | $89,160 | $20,000 | $69,160 |
| 2021 | $1,753 | $71,274 | $16,000 | $55,274 |
| 2020 | $1,652 | $67,044 | $16,000 | $51,044 |
| 2019 | $1,637 | $60,749 | $10,000 | $50,749 |
| 2018 | $1,641 | $60,749 | $10,000 | $50,749 |
| 2017 | $1,514 | $56,440 | $10,000 | $46,440 |
| 2016 | $1,405 | $53,208 | $10,000 | $43,208 |
| 2015 | $1,291 | $49,976 | $10,000 | $39,976 |
| 2014 | $1,071 | $44,385 | $8,000 | $36,385 |
Source: Public Records
Map
Nearby Homes
- 25 Peeks Ct
- 525 Hayward Bishop Way
- 909 Lawshe Rd
- 752 Lawshe Rd
- 40 Owens Path
- 15 Fieldstone Farms Dr
- 800 Rock House Rd
- 2000 Elders Mill Rd
- 38 Chapman Farm Rd
- 7 Belvoir Place
- 45 Cushing St Unit 156
- 130 Putney Way
- 107 Barnsley Farms Dr
- 291 Grove Park Unit 90
- 129 Rutland Ct
- 166 Belvoir Place
- 300 Kenwood Trail
- 245 Kenwood Trail
- 275 Kenwood Trail
- 350 Cushing St
- 430 Peeks Crossing Dr
- 450 Peeks Crossing Dr
- 420 Peeks Crossing Dr
- 460 Peeks Crossing Dr
- 445 Peeks Crossing Dr
- 425 Peeks Crossing Dr
- 410 Peeks Crossing Dr
- 455 Peeks Crossing Dr
- 415 Peeks Crossing Dr
- 470 Peeks Crossing Dr
- 435 Peeks Crossing Dr
- 405 Peeks Crossing Dr
- 465 Peeks Crossing Dr
- 400 Peeks Crossing Dr
- 525 Lawshe Rd
- 480 Peeks Crossing Dr
- 395 Peeks Crossing Dr Unit 5
- 395 Peeks Crossing Dr
- 380 Peeks Crossing Dr
- 20 Peeks Crossing Dr