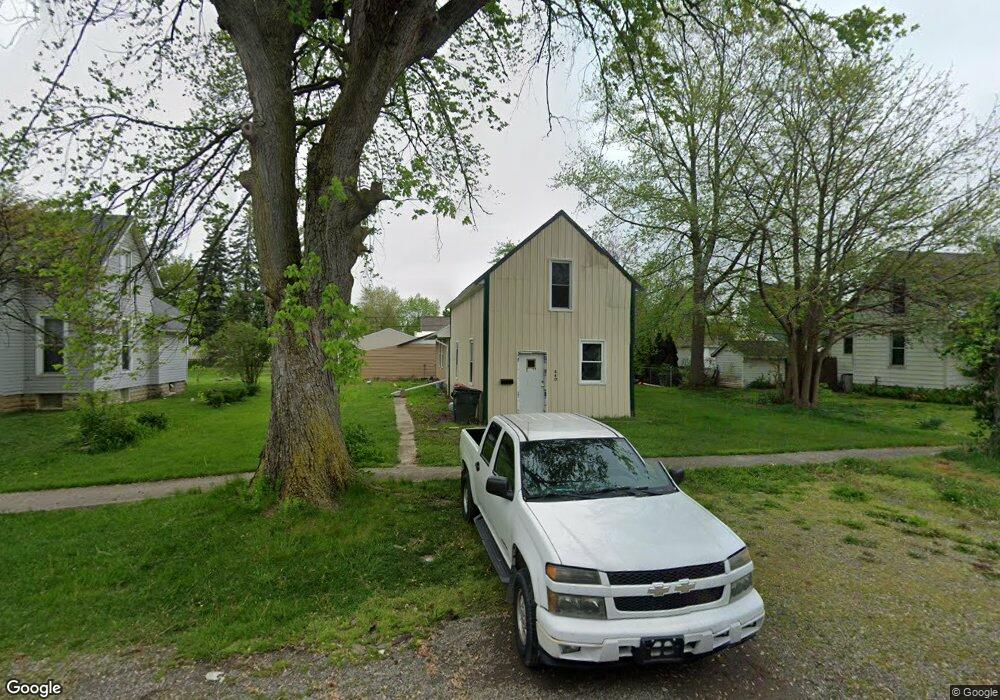
440 S Franklin St Delphos, OH 45833
Estimated Value: $95,000 - $156,000
3
Beds
1
Bath
1,586
Sq Ft
$79/Sq Ft
Est. Value
About This Home
This home is located at 440 S Franklin St, Delphos, OH 45833 and is currently estimated at $125,815, approximately $79 per square foot. 440 S Franklin St is a home located in Allen County with nearby schools including Delphos St. John's High School and Delphos St. John's Elementary School.
Ownership History
Date
Name
Owned For
Owner Type
Purchase Details
Closed on
Dec 13, 2023
Sold by
Eblin Aaron J
Bought by
Brotherwood Scott A
Current Estimated Value
Purchase Details
Closed on
Apr 24, 2023
Sold by
Proshek Lisa R
Bought by
Eblin Aaron J
Purchase Details
Closed on
Dec 20, 2022
Bought by
Lisa R Proshek
Purchase Details
Closed on
Jul 22, 2019
Sold by
Fischer Investment Propertiers Iii Llc
Bought by
Eblin Timothy M
Purchase Details
Closed on
Jun 30, 2015
Sold by
Fischer Helen M
Bought by
Fischer Investments Properties Iii Llc
Purchase Details
Closed on
Mar 1, 2002
Sold by
Schwinnen Daniel J
Bought by
Eblin Tim
Purchase Details
Closed on
Oct 25, 1996
Sold by
Schwinnen Daniel
Bought by
Briggs Eric and Briggs Kristin
Purchase Details
Closed on
Dec 15, 1989
Bought by
Schwinnen Daniel J
Create a Home Valuation Report for This Property
The Home Valuation Report is an in-depth analysis detailing your home's value as well as a comparison with similar homes in the area
Home Values in the Area
Average Home Value in this Area
Purchase History
| Date | Buyer | Sale Price | Title Company |
|---|---|---|---|
| Brotherwood Scott A | $7,500 | None Listed On Document | |
| Eblin Aaron J | $15,000 | None Listed On Document | |
| Lisa R Proshek | -- | -- | |
| Eblin Timothy M | $14,000 | None Available | |
| Fischer Investments Properties Iii Llc | -- | None Available | |
| Eblin Tim | $17,000 | -- | |
| Briggs Eric | $20,000 | -- | |
| Schwinnen Daniel J | $14,900 | -- |
Source: Public Records
Tax History Compared to Growth
Tax History
| Year | Tax Paid | Tax Assessment Tax Assessment Total Assessment is a certain percentage of the fair market value that is determined by local assessors to be the total taxable value of land and additions on the property. | Land | Improvement |
|---|---|---|---|---|
| 2024 | $907 | $28,320 | $7,910 | $20,410 |
| 2023 | $718 | $21,150 | $5,920 | $15,230 |
| 2022 | $736 | $21,150 | $5,920 | $15,230 |
| 2021 | $723 | $21,150 | $5,920 | $15,230 |
| 2020 | $614 | $19,010 | $5,640 | $13,370 |
| 2019 | $614 | $19,010 | $5,640 | $13,370 |
| 2018 | $653 | $19,010 | $5,640 | $13,370 |
| 2017 | $584 | $17,790 | $5,640 | $12,150 |
| 2016 | $598 | $17,790 | $5,640 | $12,150 |
| 2015 | $603 | $17,790 | $5,640 | $12,150 |
| 2014 | $574 | $16,880 | $5,430 | $11,450 |
| 2013 | $579 | $16,880 | $5,430 | $11,450 |
Source: Public Records
Map
Nearby Homes
- 483 S Franklin St
- 516 S Main St
- 424 S Canal St
- 221 S Main St
- 827 S Washington St
- 634 S Clay St
- 210 E 3rd St
- 633 E 2nd St
- 1001 S Adams St
- 405 N Franklin St
- 1400 S Clay St Unit 17
- 610 N Washington St
- 409 N Bredeick St
- 704 N Franklin St
- 521 Carolyn Dr
- 716 Moening St
- 604 W 6th St
- 810 N Franklin St
- 7110 Elida Rd
- 1303 Carolyn Dr
- 448 S Franklin St
- 434 S Franklin St
- 428 S Franklin St
- 441 S Pierce St
- 450 S Franklin St
- 433 S Pierce St
- 427 S Pierce St
- 453 S Pierce St
- 456 S Franklin St
- 439 S Franklin St
- 445 S Franklin St
- 433 S Franklin St
- 449 S Franklin St
- 457 S Pierce St
- 460 S Franklin St
- 453 S Franklin St
- 409 S Pierce St
- 404 S Franklin St