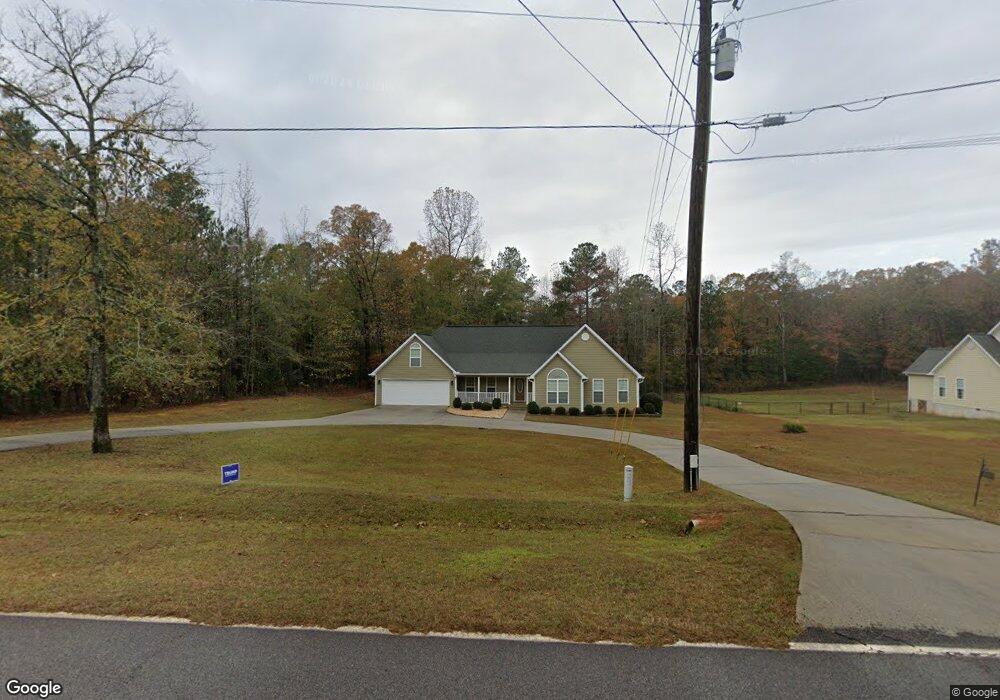
440 Thrash Rd Lagrange, GA 30241
Estimated Value: $345,142 - $523,000
3
Beds
3
Baths
2,256
Sq Ft
$194/Sq Ft
Est. Value
About This Home
This home is located at 440 Thrash Rd, Lagrange, GA 30241 and is currently estimated at $436,536, approximately $193 per square foot. 440 Thrash Rd is a home located in Troup County with nearby schools including Hogansville Elementary School, Callaway Elementary School, and Callaway Middle School.
Ownership History
Date
Name
Owned For
Owner Type
Purchase Details
Closed on
Jul 5, 2006
Sold by
Spradlin Dennis Christophe
Bought by
Bohannon Charles Lee and Bohannon Phyllis M
Current Estimated Value
Home Financials for this Owner
Home Financials are based on the most recent Mortgage that was taken out on this home.
Original Mortgage
$60,000
Outstanding Balance
$34,837
Interest Rate
6.54%
Mortgage Type
New Conventional
Estimated Equity
$401,699
Purchase Details
Closed on
Mar 6, 2006
Sold by
Harvest Construction Inc
Bought by
Spradlin Dennis Christopher and Spradlin Brandy Ann
Home Financials for this Owner
Home Financials are based on the most recent Mortgage that was taken out on this home.
Original Mortgage
$158,817
Interest Rate
6.19%
Mortgage Type
New Conventional
Purchase Details
Closed on
May 6, 2004
Sold by
Jones J T
Bought by
Harvest Construction Inc
Purchase Details
Closed on
Feb 25, 2004
Bought by
Jones J T
Create a Home Valuation Report for This Property
The Home Valuation Report is an in-depth analysis detailing your home's value as well as a comparison with similar homes in the area
Purchase History
| Date | Buyer | Sale Price | Title Company |
|---|---|---|---|
| Bohannon Charles Lee | $205,000 | -- | |
| Spradlin Dennis Christopher | $30,500 | -- | |
| Harvest Construction Inc | $100,000 | -- | |
| Jones J T | -- | -- |
Source: Public Records
Mortgage History
| Date | Status | Borrower | Loan Amount |
|---|---|---|---|
| Open | Bohannon Charles Lee | $60,000 | |
| Previous Owner | Spradlin Dennis Christopher | $158,817 |
Source: Public Records
Tax History
| Year | Tax Paid | Tax Assessment Tax Assessment Total Assessment is a certain percentage of the fair market value that is determined by local assessors to be the total taxable value of land and additions on the property. | Land | Improvement |
|---|---|---|---|---|
| 2025 | $2,690 | $107,360 | $8,480 | $98,880 |
| 2024 | $2,644 | $104,760 | $8,480 | $96,280 |
| 2023 | $2,584 | $102,560 | $8,480 | $94,080 |
| 2022 | $2,508 | $97,600 | $8,480 | $89,120 |
| 2021 | $2,555 | $92,480 | $8,000 | $84,480 |
| 2020 | $2,555 | $92,480 | $8,000 | $84,480 |
| 2019 | $2,181 | $80,080 | $6,800 | $73,280 |
| 2018 | $1,980 | $73,400 | $6,800 | $66,600 |
| 2017 | $1,980 | $73,400 | $6,800 | $66,600 |
| 2016 | $1,942 | $72,136 | $6,800 | $65,336 |
| 2015 | $1,942 | $72,136 | $6,800 | $65,336 |
| 2014 | $1,838 | $68,697 | $6,800 | $61,897 |
| 2013 | -- | $68,946 | $6,800 | $62,146 |
Source: Public Records
Map
Nearby Homes
- 829 Thrash Rd
- 0 Fincher St
- 4973 Greenville Rd
- 142 Carr Rd
- 1220 Lagrange Hwy
- 0 Alverson Rd
- 1751 Smokey Rd
- 37.23 ACRES / 0 Smokey Rd
- 91 Almond Rd
- 453 E Mount Zion Church Rd
- 0 Branch Hebron Rd Unit 10624528
- 0 Branch Hebron Rd Unit 226567
- 0 Branch Hebron Rd Unit 10709761
- 2477 Upper Big Springs Rd
- 425 Mount Zion Church Rd
- 158 S Glenn Rd
- 123 Wexford Dr
- 264 S Glenn Rd
- 194 Hines Rd
- 830 John Lovelace Rd
Your Personal Tour Guide
Ask me questions while you tour the home.