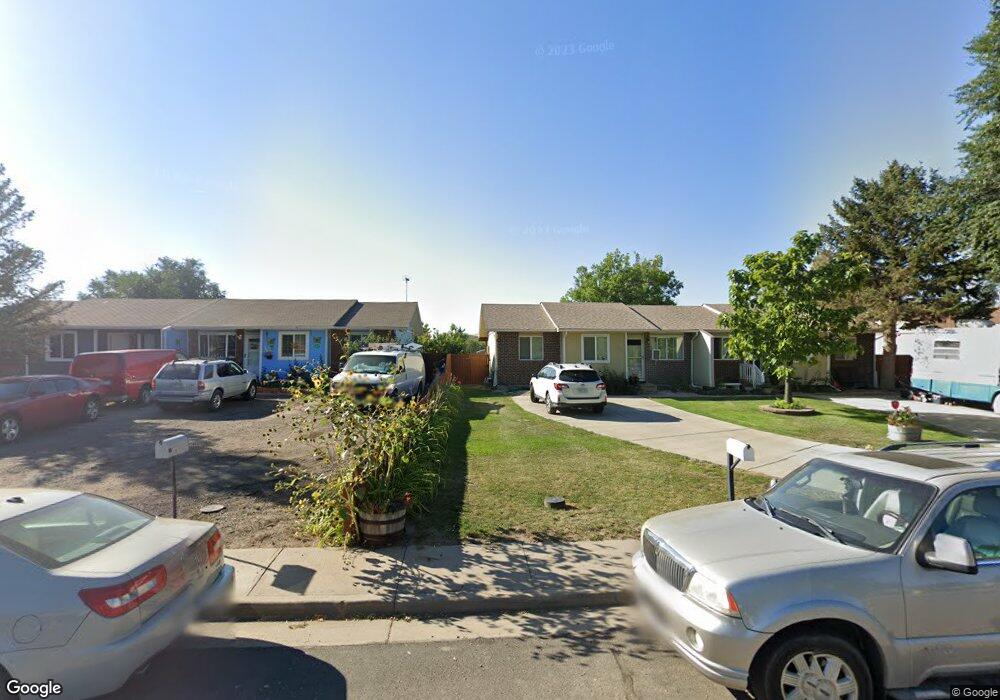
440 W Jessup St Brighton, CO 80601
Estimated Value: $293,000 - $362,000
3
Beds
1
Bath
1,812
Sq Ft
$175/Sq Ft
Est. Value
About This Home
This home is located at 440 W Jessup St, Brighton, CO 80601 and is currently estimated at $316,796, approximately $174 per square foot. 440 W Jessup St is a home located in Adams County with nearby schools including South Elementary School, Vikan Middle School, and Riverdale Ridge High School.
Ownership History
Date
Name
Owned For
Owner Type
Purchase Details
Closed on
Jul 29, 2014
Sold by
Ramirez Maria and Ramirez Angelica
Bought by
Ramirez Angelica
Current Estimated Value
Home Financials for this Owner
Home Financials are based on the most recent Mortgage that was taken out on this home.
Original Mortgage
$56,000
Outstanding Balance
$18,140
Interest Rate
4.17%
Mortgage Type
New Conventional
Estimated Equity
$298,656
Purchase Details
Closed on
Jul 15, 2008
Sold by
Wells Fargo Financial Colorado Inc
Bought by
Ramirez Maria and Ramirez Angelica
Home Financials for this Owner
Home Financials are based on the most recent Mortgage that was taken out on this home.
Original Mortgage
$66,541
Interest Rate
6.4%
Mortgage Type
FHA
Purchase Details
Closed on
Jan 15, 2008
Sold by
Cler Henry
Bought by
Wells Fargo Financial Colorado Inc
Purchase Details
Closed on
Mar 9, 1994
Sold by
Cler Mary L
Bought by
Cler Henry
Create a Home Valuation Report for This Property
The Home Valuation Report is an in-depth analysis detailing your home's value as well as a comparison with similar homes in the area
Home Values in the Area
Average Home Value in this Area
Purchase History
| Date | Buyer | Sale Price | Title Company |
|---|---|---|---|
| Ramirez Angelica | -- | Fitco | |
| Ramirez Maria | $61,756 | First American Els | |
| Wells Fargo Financial Colorado Inc | -- | None Available | |
| Cler Henry | -- | -- |
Source: Public Records
Mortgage History
| Date | Status | Borrower | Loan Amount |
|---|---|---|---|
| Open | Ramirez Angelica | $56,000 | |
| Closed | Ramirez Maria | $66,541 |
Source: Public Records
Tax History Compared to Growth
Tax History
| Year | Tax Paid | Tax Assessment Tax Assessment Total Assessment is a certain percentage of the fair market value that is determined by local assessors to be the total taxable value of land and additions on the property. | Land | Improvement |
|---|---|---|---|---|
| 2024 | $1,818 | $18,060 | $4,000 | $14,060 |
| 2023 | $1,810 | $20,160 | $4,060 | $16,100 |
| 2022 | $1,750 | $15,930 | $3,340 | $12,590 |
| 2021 | $1,639 | $15,930 | $3,340 | $12,590 |
| 2020 | $1,341 | $13,580 | $3,430 | $10,150 |
| 2019 | $1,342 | $13,580 | $3,430 | $10,150 |
| 2018 | $1,074 | $10,860 | $720 | $10,140 |
| 2017 | $1,073 | $10,860 | $720 | $10,140 |
| 2016 | $891 | $8,990 | $800 | $8,190 |
| 2015 | $889 | $8,990 | $800 | $8,190 |
| 2014 | $521 | $5,350 | $720 | $4,630 |
Source: Public Records
Map
Nearby Homes
- 362 Dogwood Ave
- 393 Ash Ave
- 313 Aspen Dr
- 765 Mockingbird St
- 804 S 1st Ave
- 230 Ash Ave Unit 4
- 730 S 2nd Ave
- 365 S 2nd Ave
- 357 S 2nd Ave
- 433 S 3rd Ave
- 544 S 3rd Ave
- 310 S 2nd Ave
- 784 S 3rd Ave
- 256 S 2nd Ave
- 658 S 4th Ave
- 219 S 3rd Ave
- 1141 Cardinal Ave
- 587 Voiles St
- 1160 Cardinal Ave
- 13150 E 160th Ave
- 436 W Jessup St
- 444 W Jessup St
- 448 W Jessup St
- 432 W Jessup St
- 428 W Jessup St
- 452 W Jessup St
- 424 W Jessup St
- 456 W Jessup St
- 494 Dogwood Ave
- 420 W Jessup St
- 460 W Jessup St
- 493 Cedar Ave
- 495 Dogwood Ave
- 416 W Jessup St
- 464 W Jessup St
- 484 Dogwood Ave
- 412 W Jessup St
- 483 Cedar Ave
- 468 W Jessup St
- 485 Dogwood Ave