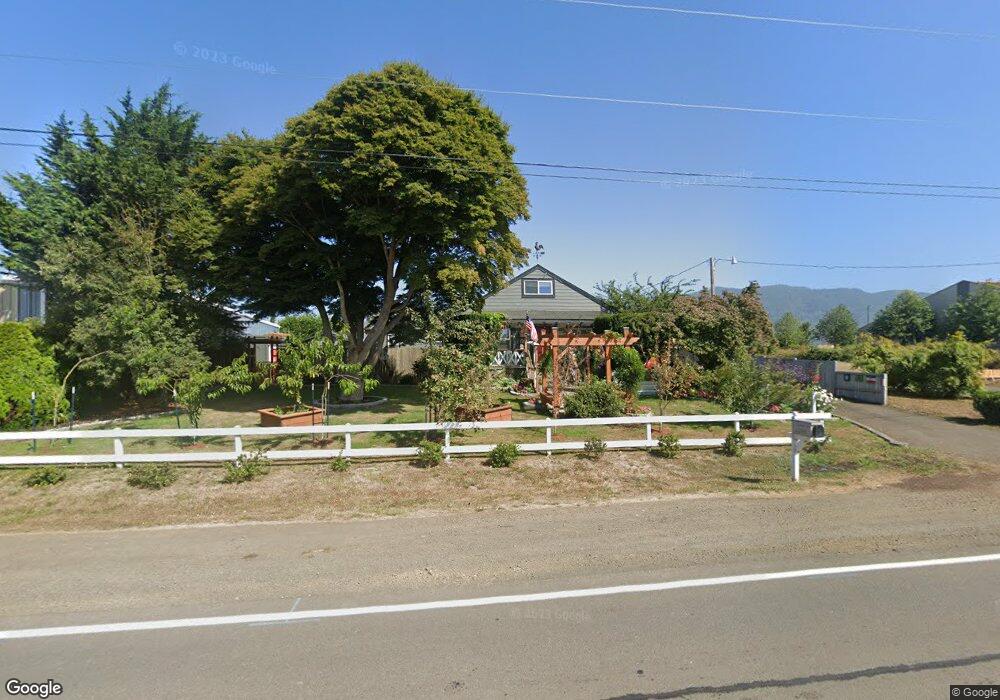
4400 3rd St Tillamook, OR 97141
Estimated Value: $389,000 - $577,000
3
Beds
2
Baths
2,284
Sq Ft
$206/Sq Ft
Est. Value
About This Home
This home is located at 4400 3rd St, Tillamook, OR 97141 and is currently estimated at $470,433, approximately $205 per square foot. 4400 3rd St is a home located in Tillamook County with nearby schools including Tillamook High School, Tillamook Adventist School, and Pacific Christian School.
Ownership History
Date
Name
Owned For
Owner Type
Purchase Details
Closed on
Apr 17, 2017
Sold by
Sagar Juli A and Sagar Jason M
Bought by
York Dale B and York Pamela A
Current Estimated Value
Home Financials for this Owner
Home Financials are based on the most recent Mortgage that was taken out on this home.
Original Mortgage
$239,510
Outstanding Balance
$197,491
Interest Rate
4.14%
Mortgage Type
VA
Estimated Equity
$272,942
Purchase Details
Closed on
Aug 9, 2016
Sold by
Eiler Kenneth S and Moody Mark Kevin
Bought by
Sagar Julie A and Sagar Jason M
Home Financials for this Owner
Home Financials are based on the most recent Mortgage that was taken out on this home.
Original Mortgage
$86,250
Interest Rate
3.43%
Mortgage Type
New Conventional
Create a Home Valuation Report for This Property
The Home Valuation Report is an in-depth analysis detailing your home's value as well as a comparison with similar homes in the area
Home Values in the Area
Average Home Value in this Area
Purchase History
| Date | Buyer | Sale Price | Title Company |
|---|---|---|---|
| York Dale B | $263,900 | First American | |
| Sagar Julie A | $115,000 | Ticor |
Source: Public Records
Mortgage History
| Date | Status | Borrower | Loan Amount |
|---|---|---|---|
| Open | York Dale B | $239,510 | |
| Previous Owner | Sagar Julie A | $86,250 |
Source: Public Records
Tax History
| Year | Tax Paid | Tax Assessment Tax Assessment Total Assessment is a certain percentage of the fair market value that is determined by local assessors to be the total taxable value of land and additions on the property. | Land | Improvement |
|---|---|---|---|---|
| 2025 | $2,522 | $238,030 | $65,410 | $172,620 |
| 2024 | $2,397 | $231,100 | $63,500 | $167,600 |
| 2023 | $2,374 | $224,370 | $61,650 | $162,720 |
| 2022 | $2,293 | $217,840 | $59,850 | $157,990 |
| 2021 | $2,225 | $211,500 | $58,110 | $153,390 |
| 2020 | $2,164 | $205,340 | $56,420 | $148,920 |
| 2019 | $2,103 | $199,360 | $54,780 | $144,580 |
| 2018 | $2,360 | $193,560 | $53,180 | $140,380 |
| 2017 | $1,937 | $158,080 | $51,630 | $106,450 |
| 2016 | $1,864 | $153,480 | $50,130 | $103,350 |
| 2015 | $1,558 | $149,010 | $48,670 | $100,340 |
| 2014 | $1,534 | $144,670 | $47,250 | $97,420 |
| 2013 | -- | $140,460 | $45,870 | $94,590 |
Source: Public Records
Map
Nearby Homes
- V/L Marolf Loop Rd
- 4004 Elmwood St
- 4009 Filbert St
- 1110 Meadow Ave
- 00 Schild Rd Unit 201
- 00 Schild Rd
- 405 Evergreen Dr
- 3413 Maple Ln
- 3810 3rd St
- 3500 Hawthorne Ln
- 0 12th St Unit 2405
- TL#02600 12th St
- 409 Del Monte Ave
- 2506 1st St
- 2507 6th St
- 2418 1st St
- Parcel 1 Wilson River Hwy
- Parcel 2 Wilson River Hwy
- 00201 Wilson River Hwy
- TL# 02100 Wilson River Hwy
Your Personal Tour Guide
Ask me questions while you tour the home.