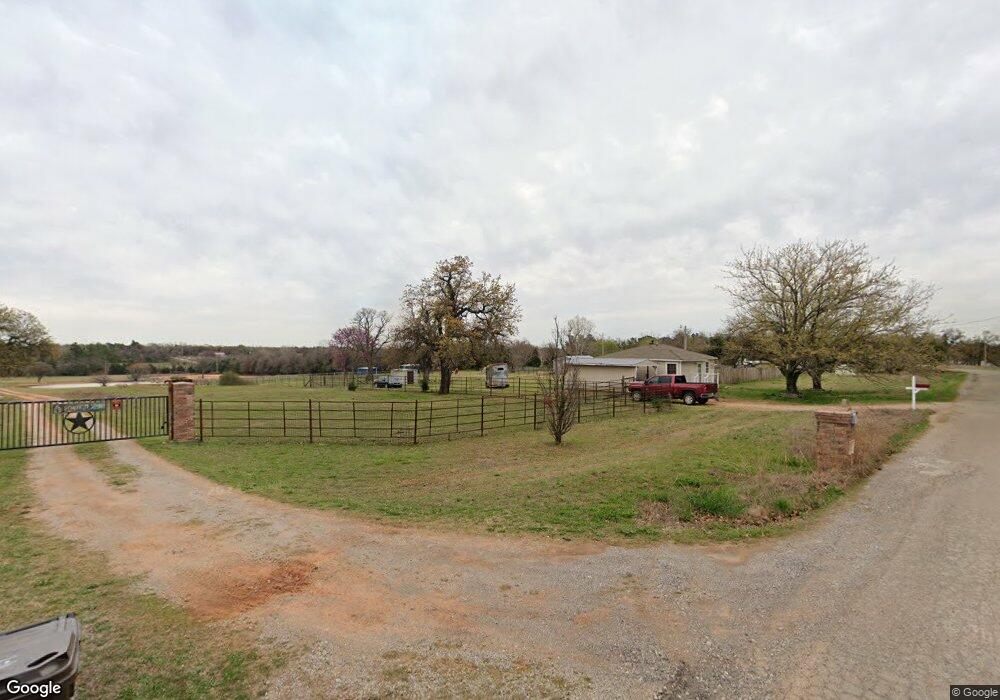
4400 Catfish Dr Newalla, OK 74857
Estimated Value: $182,000 - $201,000
3
Beds
1
Bath
864
Sq Ft
$226/Sq Ft
Est. Value
About This Home
This home is located at 4400 Catfish Dr, Newalla, OK 74857 and is currently estimated at $195,081, approximately $225 per square foot. 4400 Catfish Dr is a home located in Oklahoma County with nearby schools including Indian Meridian Elementary School, James Griffith Intermediate Elementary School, and Choctaw Middle School.
Ownership History
Date
Name
Owned For
Owner Type
Purchase Details
Closed on
Jul 21, 2016
Sold by
Burt Dave and Goodell Peggy
Bought by
Rice Linsie Cheryl
Current Estimated Value
Purchase Details
Closed on
Nov 11, 2013
Sold by
Cearley Cody A and Cearley Heather
Bought by
Burt Dave
Purchase Details
Closed on
Sep 24, 2010
Sold by
Moore Cody L and Moore Joell
Bought by
Cearley Cody A
Home Financials for this Owner
Home Financials are based on the most recent Mortgage that was taken out on this home.
Original Mortgage
$85,843
Interest Rate
4.5%
Mortgage Type
FHA
Purchase Details
Closed on
Feb 24, 2006
Sold by
Roper Charlie and Roper Cindy
Bought by
Moore Cody L
Home Financials for this Owner
Home Financials are based on the most recent Mortgage that was taken out on this home.
Original Mortgage
$78,000
Interest Rate
6.09%
Mortgage Type
Fannie Mae Freddie Mac
Create a Home Valuation Report for This Property
The Home Valuation Report is an in-depth analysis detailing your home's value as well as a comparison with similar homes in the area
Home Values in the Area
Average Home Value in this Area
Purchase History
| Date | Buyer | Sale Price | Title Company |
|---|---|---|---|
| Rice Linsie Cheryl | $128,500 | Stewart Abstract Title | |
| Burt Dave | $86,500 | Stewart Abstract & Title Of | |
| Cearley Cody A | $87,000 | Capitol Abstract & Title | |
| Moore Cody L | $78,000 | Capitol Abstract & Title |
Source: Public Records
Mortgage History
| Date | Status | Borrower | Loan Amount |
|---|---|---|---|
| Previous Owner | Cearley Cody A | $85,843 | |
| Previous Owner | Moore Cody L | $78,000 |
Source: Public Records
Tax History Compared to Growth
Tax History
| Year | Tax Paid | Tax Assessment Tax Assessment Total Assessment is a certain percentage of the fair market value that is determined by local assessors to be the total taxable value of land and additions on the property. | Land | Improvement |
|---|---|---|---|---|
| 2024 | $1,718 | $15,401 | $4,399 | $11,002 |
| 2023 | $1,718 | $14,668 | $4,669 | $9,999 |
| 2022 | $1,609 | $13,970 | $3,465 | $10,505 |
| 2021 | $1,607 | $13,970 | $3,465 | $10,505 |
| 2020 | $1,614 | $13,970 | $3,465 | $10,505 |
| 2019 | $1,616 | $13,970 | $3,465 | $10,505 |
| 2018 | $1,618 | $13,970 | $0 | $0 |
| 2017 | $1,614 | $13,969 | $3,465 | $10,504 |
| 2016 | $992 | $9,545 | $3,465 | $6,080 |
| 2015 | $991 | $9,545 | $3,465 | $6,080 |
| 2014 | $990 | $9,545 | $3,465 | $6,080 |
Source: Public Records
Map
Nearby Homes
- 4230 Sundance Ln
- 4708 Sandy Oak Ln
- 18725 Red Oak Dr
- 4353 Titan Terrace
- 17903 W Blue Ridge Road Flat W
- 3417 Glastonbury Way
- 3299 Glastonbury Way
- 3340 Somerset Farms Rd
- 3320 Somerset Farms Rd
- 18297 Chelsea Cir
- 18286 Chelsea Cir
- 19416 Cardinal Creek Dr N
- 3420 Somerset Farms Rd
- 18411 Somerset Farms Rd
- 3188 Somerset Farms Rd
- 21962 SE 44th St
- 3322 Glastonbury Way
- 3302 Glastonbury Way
- 3382 Glastonbury Way
- 3342 Glastonbury Way
- 4340 Catfish Dr
- 4500 Sandy Oak Ln
- 4420 Sundance Ln
- 4480 Sundance Ln
- 4370 Sundance Ln
- 4310 Sundance Ln
- 4501 Sandy Oak Ln
- 19250 SE 44th St
- 4510 Sandy Oak Ln
- 146 Sundance Ln
- 4380 Catfish Dr
- 4230 Catfish Dr
- 4423 Sundance Ln
- 4310 Catfish Dr
- 4260 Sundance Ln
- 19300 SE 44th St
- 4481 Sundance Ln
- 4375 Sundance Ln
- 4509 Sandy Oak Ln
- 4020 Catfish Dr