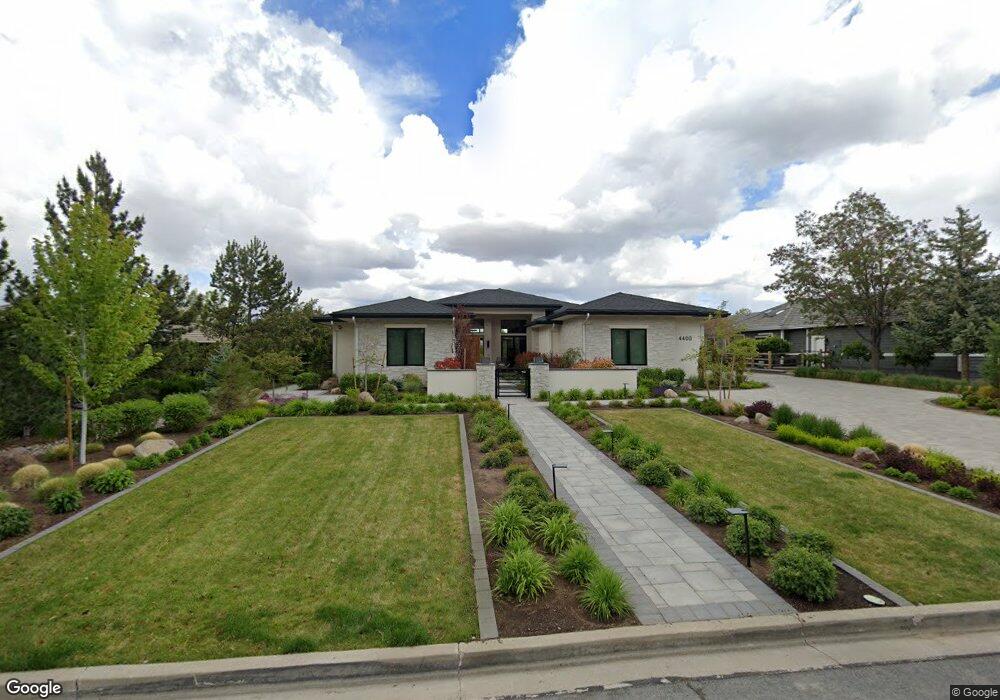
4400 Juniper Trail Unit 149 Reno, NV 89519
South Outer Reno NeighborhoodEstimated Value: $1,832,000 - $2,383,000
4
Beds
4
Baths
3,357
Sq Ft
$631/Sq Ft
Est. Value
About This Home
This home is located at 4400 Juniper Trail Unit 149, Reno, NV 89519 and is currently estimated at $2,119,215, approximately $631 per square foot. 4400 Juniper Trail Unit 149 is a home located in Washoe County with nearby schools including Roy Gomm Elementary School, Darrell C Swope Middle School, and Reno High School.
Ownership History
Date
Name
Owned For
Owner Type
Purchase Details
Closed on
Jan 23, 2019
Sold by
Delmue Al L
Bought by
Appelbaum Steven J and The Steven J Appelbaum 2005 Revocable Tr
Current Estimated Value
Purchase Details
Closed on
Oct 20, 2009
Sold by
Delmue Al L
Bought by
Al L Delmue 2009 Trusts
Purchase Details
Closed on
Dec 28, 2007
Sold by
Delmue Jason A
Bought by
Delmue Al L
Purchase Details
Closed on
Dec 18, 1998
Sold by
Hershewe Gerard and Key Terri A
Bought by
Delmue Jason A and Jason A Delmue Trust Of 1997
Purchase Details
Closed on
Oct 24, 1997
Sold by
Lloyd William J and Lloyd Cheri B
Bought by
Hershewe Gerard and Key Terri A
Purchase Details
Closed on
Nov 14, 1994
Sold by
Semenza Rudi J and Semenza Vicki L
Bought by
Lloyd William J and Lloyd Cheri B
Create a Home Valuation Report for This Property
The Home Valuation Report is an in-depth analysis detailing your home's value as well as a comparison with similar homes in the area
Home Values in the Area
Average Home Value in this Area
Purchase History
| Date | Buyer | Sale Price | Title Company |
|---|---|---|---|
| Appelbaum Steven J | $290,000 | First American Title Reno | |
| Al L Delmue 2009 Trusts | -- | None Available | |
| Delmue Al L | -- | None Available | |
| Delmue Jason A | $111,000 | Western Title Company Inc | |
| Hershewe Gerard | $105,000 | First American Title Co | |
| Lloyd William J | $107,000 | First American Title Company |
Source: Public Records
Tax History Compared to Growth
Tax History
| Year | Tax Paid | Tax Assessment Tax Assessment Total Assessment is a certain percentage of the fair market value that is determined by local assessors to be the total taxable value of land and additions on the property. | Land | Improvement |
|---|---|---|---|---|
| 2025 | $17,730 | $625,479 | $112,000 | $513,479 |
| 2024 | $17,730 | $628,054 | $112,000 | $516,054 |
| 2023 | $17,212 | $590,939 | $105,000 | $485,939 |
| 2022 | $16,705 | $492,324 | $92,750 | $399,574 |
| 2021 | $9,821 | $308,995 | $78,750 | $230,245 |
| 2020 | $1,373 | $80,669 | $78,750 | $1,919 |
| 2019 | $1,308 | $71,873 | $70,000 | $1,873 |
| 2018 | $1,248 | $71,877 | $70,000 | $1,877 |
| 2017 | $1,198 | $71,910 | $70,000 | $1,910 |
| 2016 | $1,168 | $66,613 | $64,750 | $1,863 |
| 2015 | $1,165 | $41,180 | $39,235 | $1,945 |
| 2014 | $1,129 | $32,355 | $30,450 | $1,905 |
| 2013 | -- | $31,012 | $30,450 | $562 |
Source: Public Records
Map
Nearby Homes
- 4305 Mountaingate Dr
- 4485 Mountaingate Dr
- 5195 Canyon Dr
- 4400 Mountaingate Dr
- 4595 Woodchuck Cir
- 7440 W 4th St Unit 7
- 7440 W 4th St Unit 46
- 7440 W 4th St Unit 35
- 4265 Hackamore Dr
- 30 Francovich Ct
- 4930 Woodchuck Cir Unit 4
- 4890 Woodchuck Cir Unit 3
- 4820 Woodchuck Cir Unit 2
- 4895 Woodchuck Cir Unit 16
- 4840 Keshmiri Place
- 4760 Woodchuck Cir Unit 1
- 4315 Water Hole Rd
- 4825 Woodchuck Cir Unit 17
- 4229 Christy Way
- 5045 Hunters Peak Rd Unit 13
- 4400 Juniper Trail
- 4390 Juniper Trail
- 4410 Juniper Trail
- 4380 Juniper Trail
- 4440 Juniper Trail
- 4395 Juniper Trail
- 4405 Juniper Trail
- 4385 Juniper Trail
- 4290 Meadowgate Trail
- 4370 Juniper Trail
- 4450 Juniper Trail Unit 2
- 4415 Juniper Trail
- 4280 Meadowgate Trail
- 4425 Juniper Trail Unit 1
- 4355 Juniper Trail
- 4360 Juniper Trail
- 4304 Meadowgate Trail
- 4270 Meadowgate Trail
- 711 Aspen Trail
- 4435 Juniper Trail