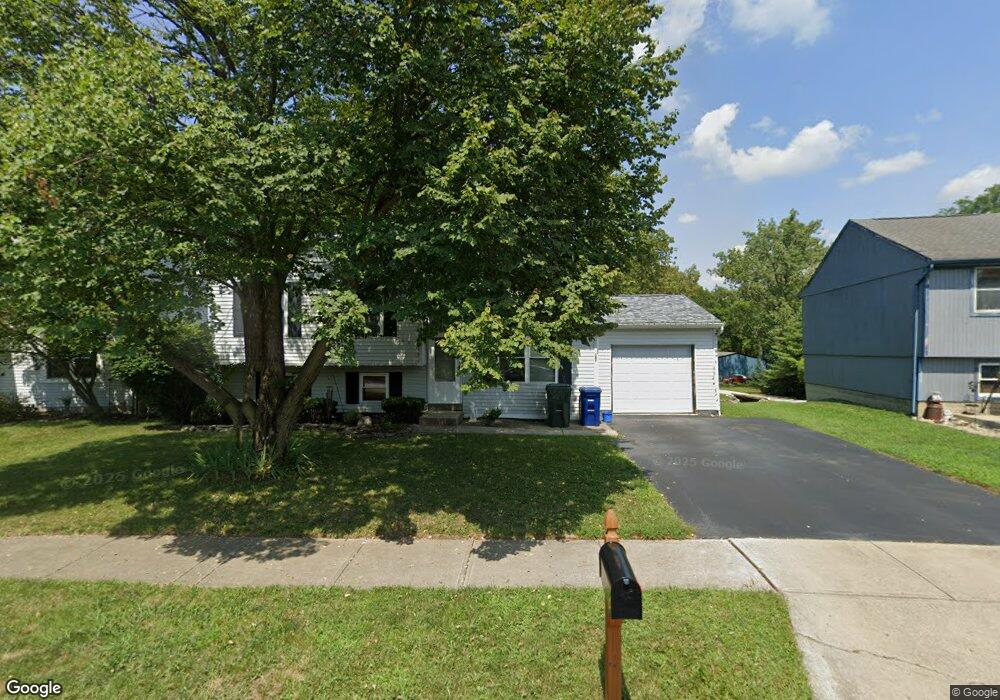
4400 Logwood Ln Columbus, OH 43228
Riverbend NeighborhoodEstimated Value: $238,000 - $267,000
4
Beds
2
Baths
904
Sq Ft
$277/Sq Ft
Est. Value
About This Home
This home is located at 4400 Logwood Ln, Columbus, OH 43228 and is currently estimated at $250,661, approximately $277 per square foot. 4400 Logwood Ln is a home located in Franklin County with nearby schools including West Franklin Elementary School, Franklin Woods Intermediate School, and Finland Middle School.
Ownership History
Date
Name
Owned For
Owner Type
Purchase Details
Closed on
Jul 29, 2015
Sold by
Heald Frederick A and Minoose Lynda Y J
Bought by
Heald Frederick A
Current Estimated Value
Home Financials for this Owner
Home Financials are based on the most recent Mortgage that was taken out on this home.
Original Mortgage
$122,513
Outstanding Balance
$95,961
Interest Rate
3.91%
Mortgage Type
VA
Estimated Equity
$154,700
Purchase Details
Closed on
Nov 8, 1999
Sold by
Lytle Mark J and Lytle Tracey
Bought by
Heald Frederick A and Minoose Lynda Y J
Home Financials for this Owner
Home Financials are based on the most recent Mortgage that was taken out on this home.
Original Mortgage
$99,960
Interest Rate
6.25%
Mortgage Type
VA
Purchase Details
Closed on
Sep 25, 1992
Bought by
Lytle Mark J
Purchase Details
Closed on
Jan 1, 1987
Purchase Details
Closed on
May 1, 1986
Create a Home Valuation Report for This Property
The Home Valuation Report is an in-depth analysis detailing your home's value as well as a comparison with similar homes in the area
Home Values in the Area
Average Home Value in this Area
Purchase History
| Date | Buyer | Sale Price | Title Company |
|---|---|---|---|
| Heald Frederick A | -- | Attorney | |
| Heald Frederick A | $98,000 | Chicago Title | |
| Lytle Mark J | $78,900 | -- | |
| -- | $58,800 | -- | |
| -- | -- | -- |
Source: Public Records
Mortgage History
| Date | Status | Borrower | Loan Amount |
|---|---|---|---|
| Open | Heald Frederick A | $122,513 | |
| Closed | Heald Frederick A | $99,960 |
Source: Public Records
Tax History Compared to Growth
Tax History
| Year | Tax Paid | Tax Assessment Tax Assessment Total Assessment is a certain percentage of the fair market value that is determined by local assessors to be the total taxable value of land and additions on the property. | Land | Improvement |
|---|---|---|---|---|
| 2024 | $2,893 | $79,350 | $28,840 | $50,510 |
| 2023 | $2,842 | $79,345 | $28,840 | $50,505 |
| 2022 | $2,352 | $48,200 | $15,020 | $33,180 |
| 2021 | $2,400 | $48,200 | $15,020 | $33,180 |
| 2020 | $2,386 | $48,200 | $15,020 | $33,180 |
| 2019 | $2,225 | $39,660 | $12,530 | $27,130 |
| 2018 | $2,117 | $39,660 | $12,530 | $27,130 |
| 2017 | $2,204 | $39,660 | $12,530 | $27,130 |
| 2016 | $2,020 | $33,390 | $7,420 | $25,970 |
| 2015 | $2,020 | $33,390 | $7,420 | $25,970 |
| 2014 | $2,022 | $33,390 | $7,420 | $25,970 |
| 2013 | $1,113 | $37,065 | $8,225 | $28,840 |
Source: Public Records
Map
Nearby Homes
- 4459 Amwood St
- 4483 White Leaf Way
- 4518 Hall Rd
- 4419 Hammerton Dr Unit 13D
- 4655 Parkwick Dr
- 829 Crevis Ln
- 1599 Covina Dr
- 1800 Georgesville Square Dr
- 4190 Salem Dr
- 4201 Sexton Dr
- 3997 Briggs Rd
- 4146 Sexton Dr
- 4212 Sexton Dr
- 673 Roth Ave
- 3814 Clime Rd
- 4220 Atlanta Dr
- 1751 Carrigallen Ln
- 3766 Dunlane Ct
- 3727-3729 Briggs Rd
- 4650 Parrau Dr Unit 67E
- 4408 Logwood Ln
- 4392 Logwood Ln
- 4416 Logwood Ln
- 4411 Logwood Ln
- 4384 Logwood Ln
- 4408 Hickory Wood Dr
- 4378 Hickory Wood Dr
- 4429 Amwood St
- 4424 Logwood Ln
- 4370 Hickory Wood Dr
- 4414 Hickory Wood Dr
- 4364 Hickory Wood Dr
- 4435 Amwood St
- 4432 Logwood Ln
- 4439 Logwood Ln
- 4439 Amwood St
- 4420 Hickory Wood Dr
- 4389 Hickory Wood Dr
- 4397 Hickory Wood Dr
- 4383 Hickory Wood Dr