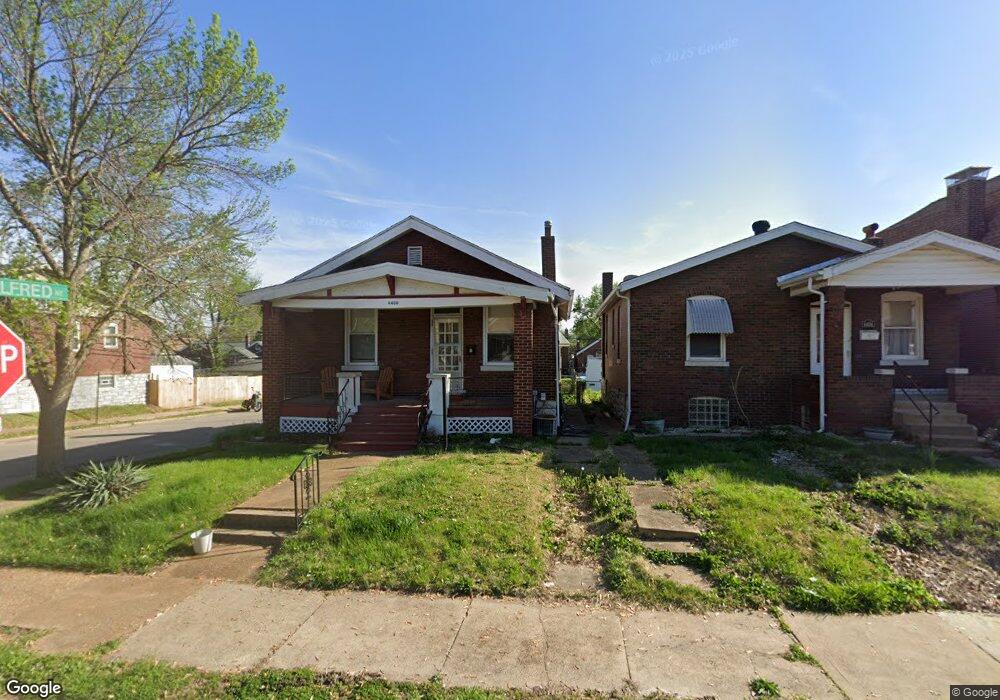
4400 Taft Ave Saint Louis, MO 63116
Bevo Mill NeighborhoodEstimated Value: $90,000 - $150,000
--
Bed
1
Bath
1,664
Sq Ft
$67/Sq Ft
Est. Value
About This Home
This home is located at 4400 Taft Ave, Saint Louis, MO 63116 and is currently estimated at $112,116, approximately $67 per square foot. 4400 Taft Ave is a home located in St. Louis City with nearby schools including Oak Hill Elementary School, Long International Middle School, and Roosevelt High School.
Ownership History
Date
Name
Owned For
Owner Type
Purchase Details
Closed on
Sep 16, 2022
Sold by
9 Fruits Llc
Bought by
House Of Hera Llc
Current Estimated Value
Purchase Details
Closed on
Mar 15, 2021
Sold by
Amjac Properties Llc
Bought by
9 Fruits Llc
Home Financials for this Owner
Home Financials are based on the most recent Mortgage that was taken out on this home.
Original Mortgage
$95,200
Interest Rate
2.73%
Mortgage Type
Future Advance Clause Open End Mortgage
Purchase Details
Closed on
Mar 23, 2016
Sold by
Powers Jacob R
Bought by
Amjac Properties Llc
Purchase Details
Closed on
Mar 19, 2015
Sold by
Lb Family Investments Llc
Bought by
Powers Jacob
Purchase Details
Closed on
Feb 25, 2015
Sold by
Jones Elsie M and Farris Rebecca D
Bought by
Lb Family Investments Llc
Purchase Details
Closed on
Jul 10, 1997
Sold by
Jones Elsie M
Bought by
Locke Janice M and Farris Rebecca D
Create a Home Valuation Report for This Property
The Home Valuation Report is an in-depth analysis detailing your home's value as well as a comparison with similar homes in the area
Home Values in the Area
Average Home Value in this Area
Purchase History
| Date | Buyer | Sale Price | Title Company |
|---|---|---|---|
| House Of Hera Llc | -- | -- | |
| 9 Fruits Llc | $61,000 | Vision Title | |
| Amjac Properties Llc | -- | None Available | |
| Powers Jacob | -- | None Available | |
| Lb Family Investments Llc | -- | Ort | |
| Locke Janice M | -- | -- |
Source: Public Records
Mortgage History
| Date | Status | Borrower | Loan Amount |
|---|---|---|---|
| Previous Owner | 9 Fruits Llc | $95,200 |
Source: Public Records
Tax History Compared to Growth
Tax History
| Year | Tax Paid | Tax Assessment Tax Assessment Total Assessment is a certain percentage of the fair market value that is determined by local assessors to be the total taxable value of land and additions on the property. | Land | Improvement |
|---|---|---|---|---|
| 2025 | $1,398 | $18,490 | $1,220 | $17,270 |
| 2024 | $1,331 | $16,370 | $1,220 | $15,150 |
| 2023 | $1,331 | $16,370 | $1,220 | $15,150 |
| 2022 | $1,267 | $14,990 | $1,220 | $13,770 |
| 2021 | $1,265 | $14,990 | $1,220 | $13,770 |
| 2020 | $1,172 | $13,970 | $1,220 | $12,750 |
| 2019 | $1,168 | $13,970 | $1,220 | $12,750 |
| 2018 | $1,075 | $12,430 | $1,220 | $11,210 |
| 2017 | $1,057 | $12,430 | $1,220 | $11,210 |
| 2016 | $925 | $10,700 | $1,220 | $9,480 |
| 2015 | $840 | $10,700 | $1,220 | $9,480 |
| 2014 | $865 | $10,700 | $1,220 | $9,480 |
| 2013 | -- | $11,040 | $1,220 | $9,820 |
Source: Public Records
Map
Nearby Homes
- 4350 Ellenwood Ave
- 4343 Neosho St
- 4333 Neosho St
- 4334 Beethoven Ave
- 4453 Morganford Rd
- 4419 Gannett St
- 4455 Ellenwood Ave
- 4265 Ellenwood Ave
- 4441 Gannett St
- 4447 Gannett St
- 4631 Morganford Rd
- 4460 Neosho St
- 4355 Osceola St
- 4230 Beethoven Ave
- 4455 Itaska St
- 4472 Gannett St
- 4436 Itaska St
- 4215 Neosho St
- 4357 Wallace St
- 4219 Ellenwood Ave
- 4372 Taft Ave
- 4370 Taft Ave
- 4366 Taft Ave
- 4360 Taft Ave
- 4406 Taft Ave
- 4373 Ellenwood Ave
- 4369 Ellenwood Ave
- 4367 Ellenwood Ave
- 4410 Taft Ave
- 4401 Ellenwood Ave
- 4356 Taft Ave
- 4363 Ellenwood Ave
- 4405 Ellenwood Ave
- 4401 Taft Ave
- 4361 Ellenwood Ave
- 4405 Taft Ave
- 4354 Taft Ave
- 4414 Taft Ave
- 4407 Ellenwood Ave
- 4357 Ellenwood Ave