Estimated Value: $274,000 - $282,490
3
Beds
2
Baths
1,400
Sq Ft
$198/Sq Ft
Est. Value
About This Home
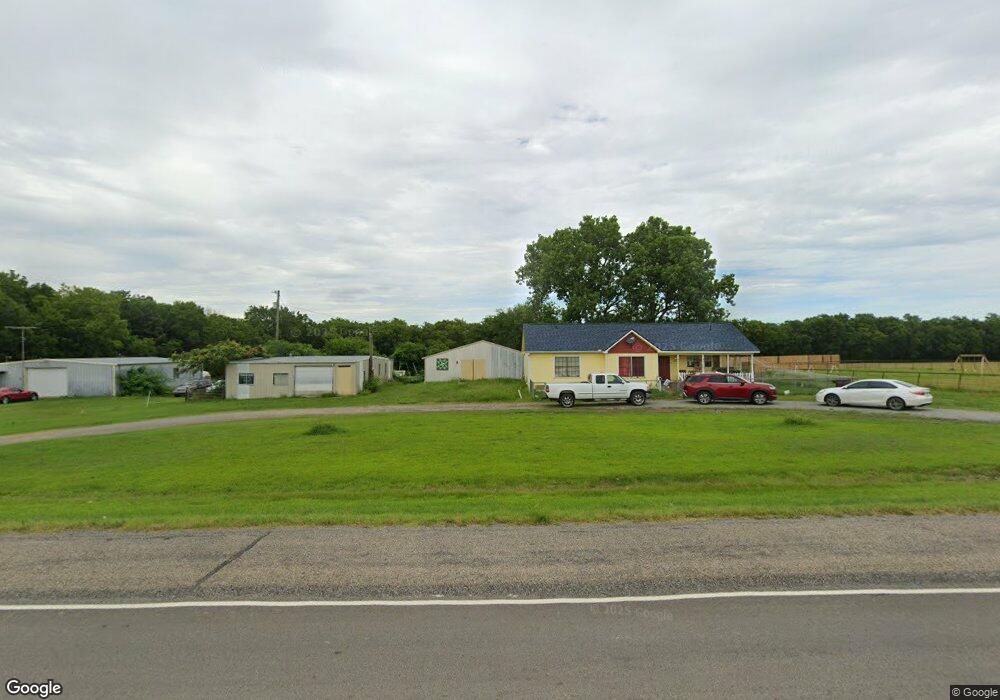
This home is located at 4400 W Texas Highway 56, Ector, TX 75439 and is currently estimated at $277,373, approximately $198 per square foot. 4400 W Texas Highway 56 is a home located in Fannin County with nearby schools including Ector Elementary School and Ector High School.
Ownership History
Date
Name
Owned For
Owner Type
Purchase Details
Closed on
Jul 14, 2022
Sold by
Gandert Louise M
Bought by
Montoya Sheila D
Current Estimated Value
Home Financials for this Owner
Home Financials are based on the most recent Mortgage that was taken out on this home.
Original Mortgage
$184,000
Outstanding Balance
$172,676
Interest Rate
4%
Mortgage Type
New Conventional
Estimated Equity
$104,697
Purchase Details
Closed on
Feb 22, 2022
Sold by
Louise M Gandert Revocable Living Trust
Bought by
Gandert Louise M
Home Financials for this Owner
Home Financials are based on the most recent Mortgage that was taken out on this home.
Original Mortgage
$120,000
Interest Rate
3.69%
Mortgage Type
Credit Line Revolving
Purchase Details
Closed on
Sep 18, 2006
Sold by
Gandert Louise
Bought by
Louise M Gandert Revocable Living Trust
Create a Home Valuation Report for This Property
The Home Valuation Report is an in-depth analysis detailing your home's value as well as a comparison with similar homes in the area
Home Values in the Area
Average Home Value in this Area
Purchase History
| Date | Buyer | Sale Price | Title Company |
|---|---|---|---|
| Montoya Sheila D | -- | Cole Title | |
| Gandert Louise M | -- | New Title Company Name | |
| Louise M Gandert Revocable Living Trust | -- | None Available |
Source: Public Records
Mortgage History
| Date | Status | Borrower | Loan Amount |
|---|---|---|---|
| Open | Montoya Sheila D | $184,000 | |
| Previous Owner | Gandert Louise M | $120,000 |
Source: Public Records
Tax History Compared to Growth
Tax History
| Year | Tax Paid | Tax Assessment Tax Assessment Total Assessment is a certain percentage of the fair market value that is determined by local assessors to be the total taxable value of land and additions on the property. | Land | Improvement |
|---|---|---|---|---|
| 2025 | $2,785 | $251,330 | $125,140 | $126,190 |
| 2024 | $2,785 | $255,500 | $113,800 | $141,700 |
| 2023 | $3,138 | $245,180 | $102,450 | $142,730 |
| 2022 | $2,528 | $219,530 | $76,090 | $143,440 |
| 2021 | $2,590 | $160,970 | $46,390 | $114,580 |
| 2020 | $2,482 | $150,680 | $43,610 | $107,070 |
| 2019 | $2,410 | $138,330 | $29,260 | $109,070 |
| 2018 | $2,191 | $116,280 | $22,770 | $93,510 |
| 2017 | $2,143 | $113,710 | $22,770 | $90,940 |
| 2016 | $2,083 | $110,490 | $20,500 | $89,990 |
| 2015 | -- | $105,430 | $18,150 | $87,280 |
| 2014 | -- | $103,120 | $16,500 | $86,620 |
Source: Public Records
Map
Nearby Homes
- 0000 S Oak St
- 111 N Oak St
- 211 E Cardinal St
- 213 E Cardinal St
- 104 Mockingbird St
- 600 Samantha Cir
- TBD Texas 56
- 302 N Main St
- 404 Church St
- 222 W Cardinal St
- 899 W Cardinal St
- 310 W Cardinal St
- 402 W Sam Rayburn Rd
- TBD County Road 4040
- 1221 County Road 4045
- 968 County Road 4040
- 8929 W Fm 898
- 8899 W Fm 898
- TBD W Us Highway 82
- 2039 Co Rd 4130
- 4400 W Texas Highway 56
- 4416 W Texas Highway 56
- 4436 W Texas Highway 56
- 4333 W Texas Highway 56
- 4333 W Texas Highway 56
- 4320 W Texas Highway 56
- 4439 W Texas Highway 56
- 4499 W Texas Highway 56
- 4369 W Texas Highway 56
- 4271 W Texas Highway 56
- 406 Wren
- 4436 E Hwy 56
- 404 Wren
- 407 E Sam Rayburn Rd
- 110 Wren
- 409 E Sam Rayburn Rd
- 405 E Sam Rayburn Rd
- 202 Wren
- 402 Wren
- 401 S Oak St